Excel 2007
Protect Excel spreadsheet options
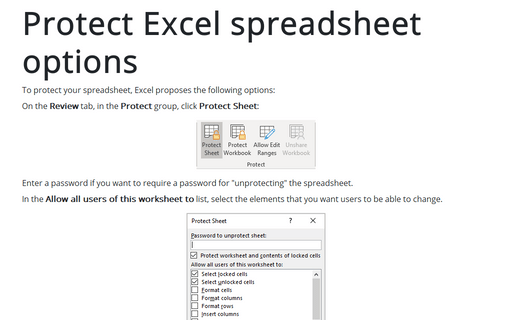
To protect your spreadsheet, Excel proposes the following options:
How to manage Add-ins
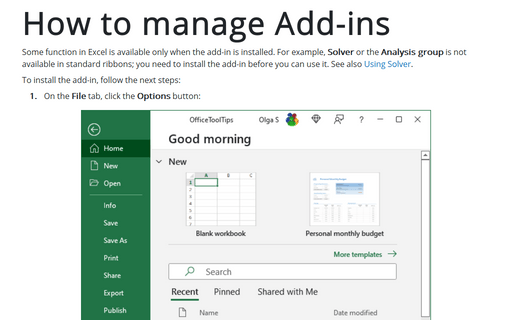
Some function in Excel is available only when the add-in is installed. For example, Solver or the
Analysis group is not available in standard ribbons, you need to install the add-in before you can
use it. See also Using Solver.
How to change default chart
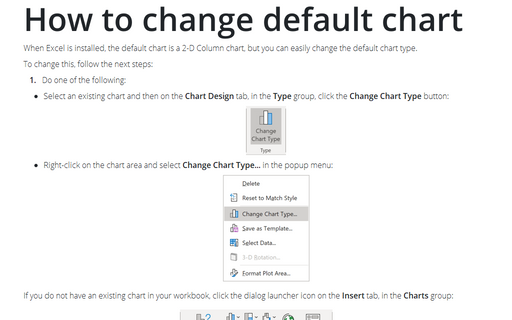
When Excel is installed, the default chart is a 2-D Column chart but you can easily change the default chart
type.
Making a spreadsheet very hidden
Using the Hide command you can hide the data and formulas from "inquisitive minds". But some of them
still can use Unhide command. Nevertheless you can completely hide Excel spreadsheet so that it will
be needed some VBA programming to unhide it.
Center text across multiple columns
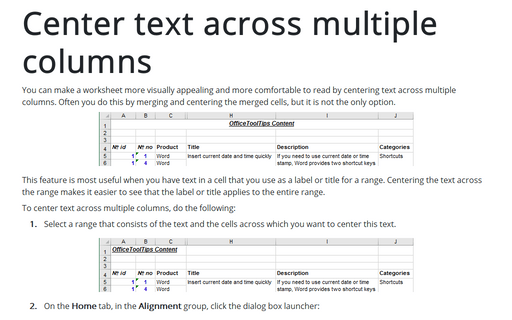
You can make a worksheet more visually appealing and easier to read by centering text across multiple
columns. Often you do this by merging and centering the merged cells, but it is not the only option.
How to create Master and Scrolled Detail charts
When you create a chart with a scroll bar, it will be useful create a chart with all data to see which data
fragment you see in the scrolling chart.
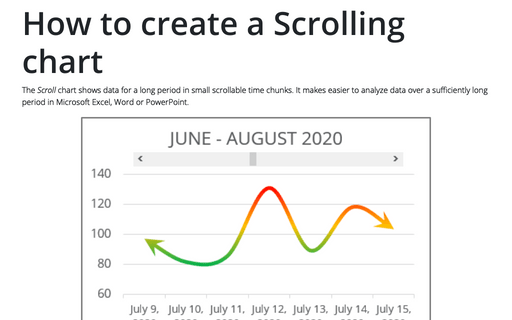
How to create a Scrolling chart
Sometimes you need to create a chart that shows a large data amount. Then it would be useful to insert a
scroll bar in your chart.
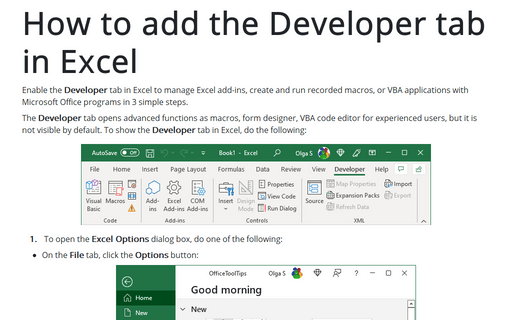
How to add the Developer tab in Excel
You should display the Developer tab when you want to write macros, run macros that you previously
recorded, or create applications to use with Microsoft Office programs. Do the following:
How to fix the chart data
You can unlink a chart from its data ranges and produce a static chart that remains unaffected by later
changes in the data.
Bubble and Area chart
In this tip we will show how to different charts could be combined in the one chart. In example we will
combine a Bubble chart with an Area chart:
