How to create an equilateral triangle, a regular square, and other regular polygons in Word
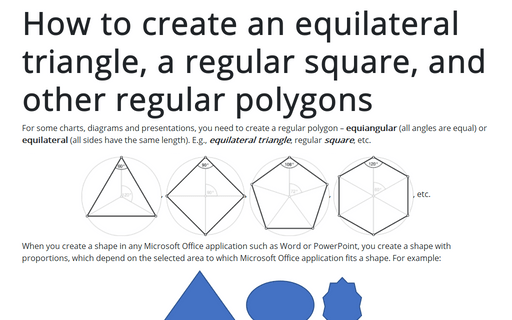
For some charts or diagrams, you need to create a regular polygon – equiangular
(all angles are equal) or equilateral (all sides have the same length).
E.g., equilateral triangle, regular square, etc.
Prepare the presentation for printing
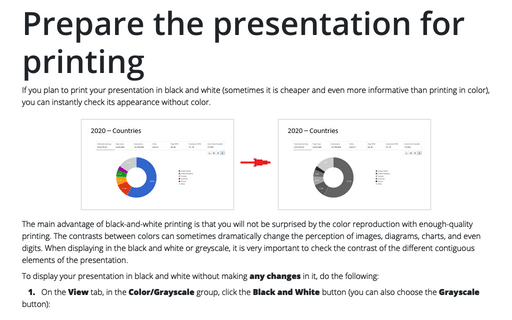
If you plan to print your presentation in black and white (sometimes it is cheaper and even more informative than printing in color), you can instantly check its appearance without color.
How to create an equilateral triangle, a regular square, and other regular polygons
For some charts, diagrams and presentations, you need to create a regular polygon – equiangular
(all angles are equal) or equilateral (all sides have the same length).
E.g., equilateral triangle, regular square, etc.
How to select and format object in the slide with a big number of objects
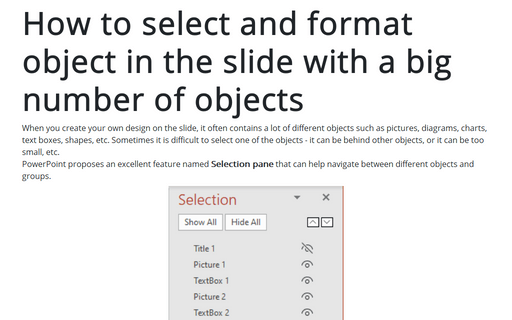
When you create your own design on the slide, it often contains a lot of different objects such as pictures, diagrams, charts, text boxes, shapes, etc. Sometimes it is difficult to select one of the objects - it can be behind other objects, or it can be too small, etc.
SketchBubble Review - Engaging Presentations at Your Fingertips
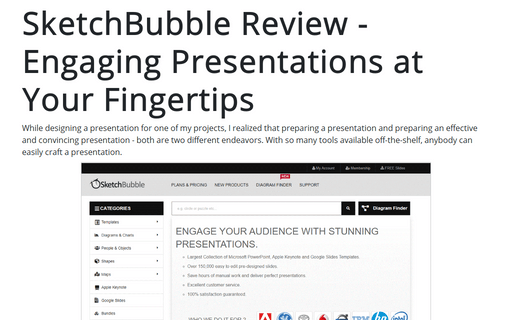
While designing a presentation for one of my projects, I realized that preparing a presentation and preparing an effective and convincing presentation - both are two different endeavors. With so many tools available off-the-shelf, anybody can easily craft a presentation.
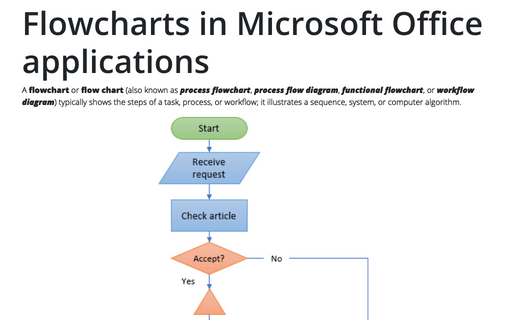
Flowcharts in Microsoft Office applications
A flowchart or flow chart (also known as process flowchart, process flow diagram, functional flowchart, or workflow diagram) typically shows the steps of a task, process, or workflow; it illustrates a sequence, system, or computer algorithm.
Recalculating the worksheet
By default, Excel automatic recalculation feature is enabled. Thus, all formulas in the workbook sheets recalculate immediately after data dependencies change. Automatic recalculation of all formulas also occurs when opening a workbook.
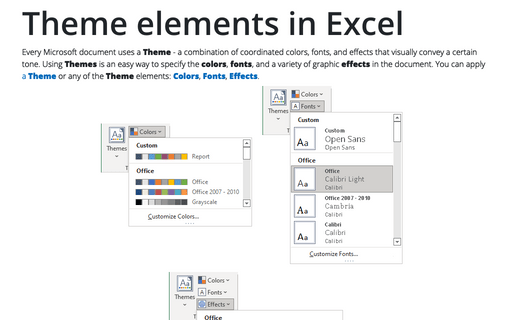
Theme elements in Excel
Every Microsoft document uses a Theme - a combination of coordinated colors, fonts, and effects that visually convey a certain tone. Using Themes is an easy way to specify the colors, fonts, and a variety of graphic effects in the document. You can apply a Theme or any of the Theme elements: Colors, Fonts, Effects.
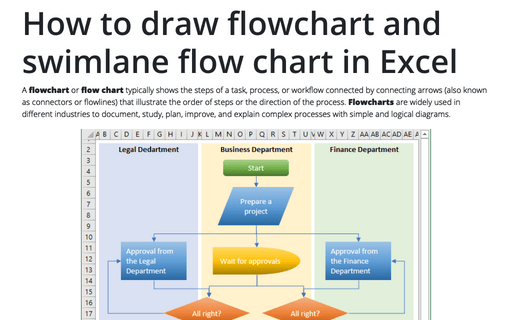
How to draw flowchart and swimlane flow chart in Excel
A flowchart or flow chart typically shows the steps of a task, process, or workflow connected
by connecting arrows (also known as connectors or flowlines) that illustrate the order of steps or the
direction of the process. Flowcharts are widely used in different industries to document, study,
plan, improve, and explain complex processes with simple and logical diagrams.
How to work with multiple items in MS Office
When you work with a document, several documents or a presentation, it will be useful to have at hand
several objects at once such as text blocks (from Internet, other document or e-mail), charts or graphics
and even some pictures.
