Excel 2016
Copy and paste only nonblank cells
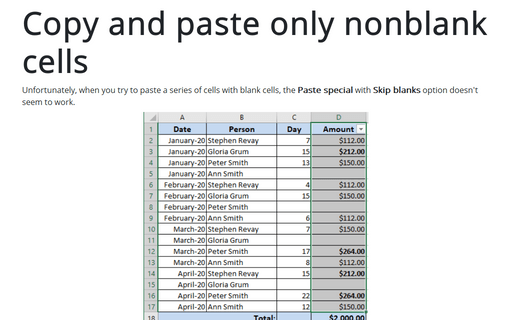
Unfortunately, when you try to paste a series of cells with blank cells, Paste special with Skip
blanks option doesn't seem to work.
Unmerging all merged cells
Here's a quick way to unmerge all merged cells in a worksheet:
Quick way to select all cells
This tip will help you to select all cells in the worksheet in one click.
How to turn on/off the Quick Analysis feature
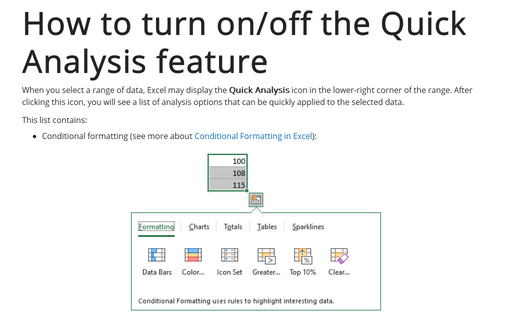
When you select a range of data, Excel displays a Quick Analysis button in the lower-right corner of
the range. But this option can be turned off.
How to change default chart
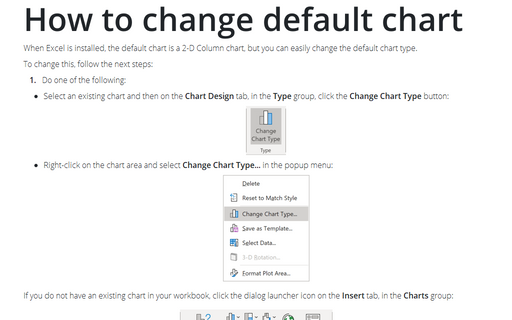
When Excel is installed, the default chart is a 2-D Column chart, but you can easily change the default chart
type.
Displaying conditional colors in a column chart
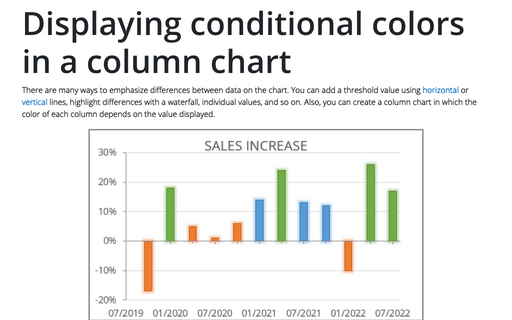
To emphasize differences between data in the chart it will be interesting to create a column chart in which
the color of each column depends on the value displayed.
Simple combination chart
Sometimes you want to show a single chart that consists of series that use different chart types.
How to create Master and Scrolled Detail charts
When you create a chart with a scroll bar, it will be useful to create a chart with all data to see which
data fragment you see in the scrolling chart.
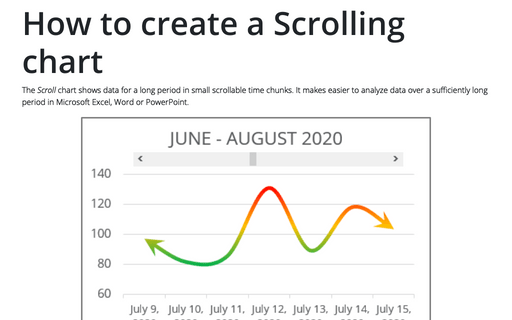
How to create a Scrolling chart
Sometimes you need to create a chart that shows a large data amount. Then it would be useful to insert a
scroll bar in your chart:
Bubble and Area chart
In this tip, we will show how to different charts could be combined in the one chart. For example, we will
combine a Bubble chart with an Area chart:
