Create bidirectional bar chart in Excel
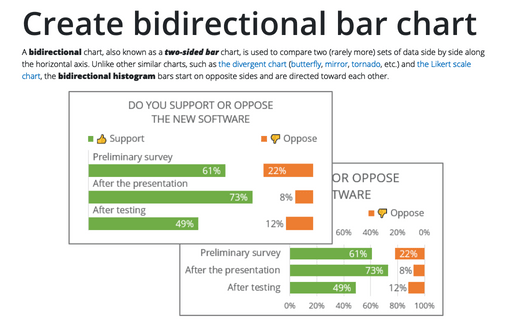
A bidirectional chart, also known as a two-sided bar chart, is used to compare two (rarely more) sets of data side by side along the horizontal axis. Unlike other similar charts, such as the divergent chart (butterfly, mirror, tornado, etc.) and the Likert scale chart, the bidirectional histogram bars start on opposite sides and are directed toward each other.
How to create Butterfly chart in Excel
A butterfly chart is a simplified version of a diverging chart, also known as a divergent chart. Unlike a diverging chart, a butterfly chart can only compare two data sets using two horizontal bars with a central baseline.
Using the formula bar as a calculator
If you simply need to perform a calculation, you can use the Formula bar as a calculator.
How to make Mirror chart in Excel
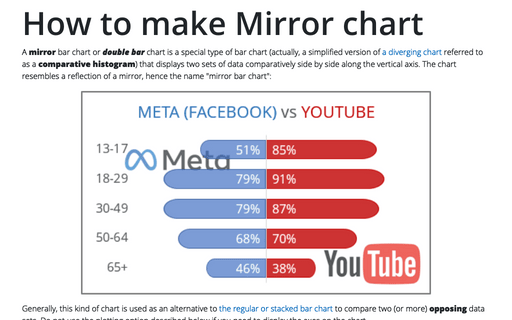
A mirror bar chart or double bar chart is a special type of bar chart (actually, a simplified version of a diverging chart referred to as a comparative histogram) that displays two sets of data comparatively side by side along the vertical axis. The chart resembles a reflection of a mirror, hence the name "mirror bar chart":
Calculating the difference between two time stamps
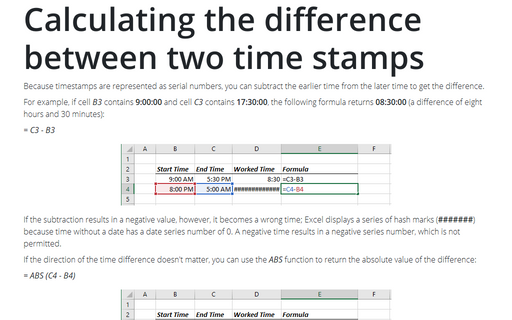
Because timestamps are represented as serial numbers, you can subtract the earlier time from the later time
to get the difference.
Competition chart with residual data
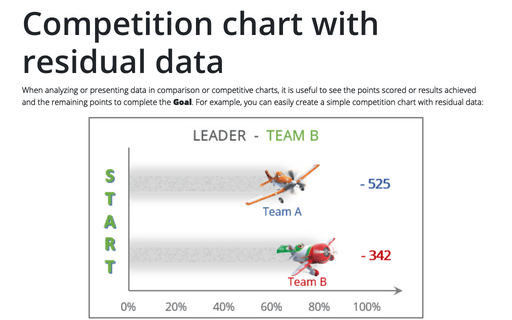
When analyzing or presenting data in comparison or competitive charts, it is useful to see the points scored or results achieved and the remaining points to complete the Goal. For example, you can easily create a simple competition chart with residual data:
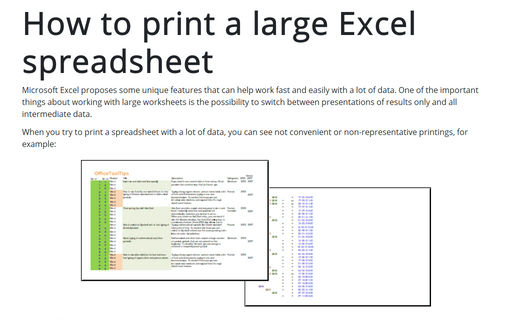
How to print a large Excel spreadsheet
Microsoft Excel proposes some unique features that can help work fast and easily with a lot of data. One of the important things about working with large worksheets is the possibility to switch between presentations of results only and all intermediate data.
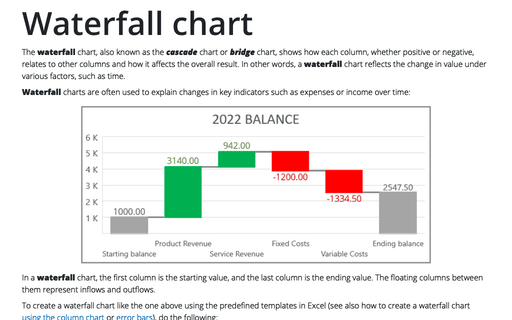
Waterfall chart
The waterfall chart, also known as the cascade chart or bridge chart, shows how each column, whether positive or negative, relates to other columns and how it affects the overall result. In other words, a waterfall chart reflects the change in value under various factors, such as time.
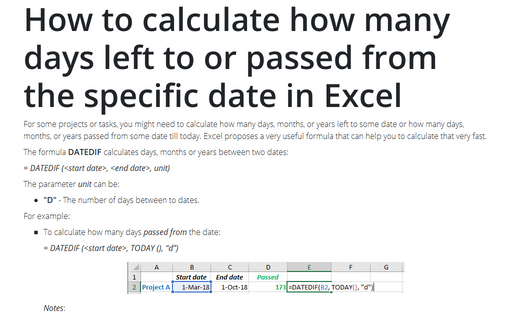
How to calculate how many days left to or passed from the specific date in Excel
For some projects or tasks, you might need to calculate how many days, months, or years left to some date or how many days, months, or years passed from some date till today. Excel proposes a very useful formula that can help you to calculate that very fast.
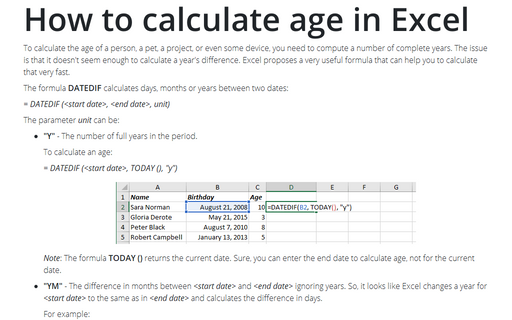
How to calculate age in Excel
To calculate the age of a person, a pet, a project, or even some device, you need to compute a
number of complete years. The issue is that it doesn't seem enough to calculate a year's difference.
Excel proposes a very useful formula that can help you to calculate that very fast.
