Side by side comparison bar chart
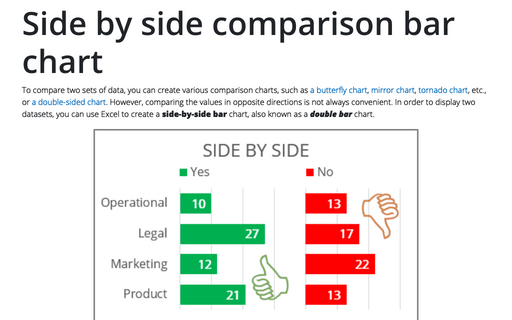
To compare two sets of data, you can create various comparison charts, such as a butterfly chart, mirror chart, tornado chart, etc., or a double-sided chart. However, comparing the values in opposite directions is not always convenient. In order to display two datasets, you can use Excel to create a side-by-side bar chart, also known as a double bar chart.
How to plot investment opportunity zones in Excel
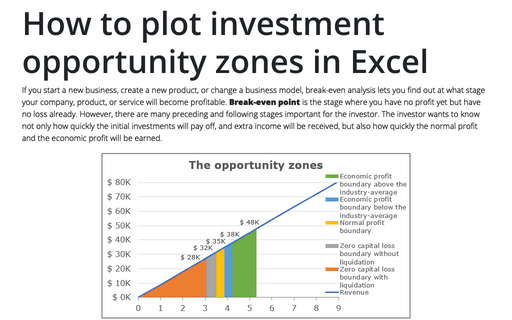
If you start a new business, create a new product, or change a business model, break-even analysis lets you find out at what stage your company, product, or service will become profitable. Break-even point is the stage where you have no profit yet but have no loss already. However, there are many preceding and following stages important for the investor. The investor wants to know not only how quickly the initial investments will pay off, and extra income will be received, but also how quickly the normal profit and the economic profit will be earned.
How to change flowchart connector or flowline
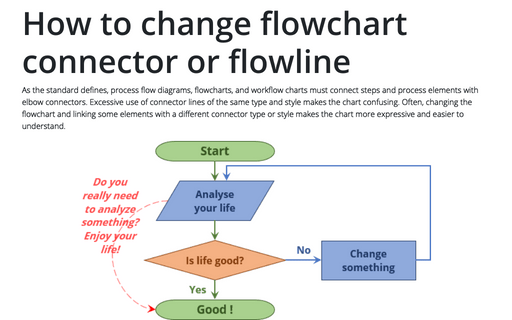
As the standard defines, process flow diagrams, flowcharts, and workflow charts must connect steps and process elements with elbow connectors. Excessive use of connector lines of the same type and style makes the chart confusing. Often, changing the flowchart and linking some elements with a different connector type or style makes the chart more expressive and easier to understand.
Using the Organizational Chart Tool
The organizational chart, or organigram, is a diagram of the structure and
relationships of the company or other organization. If you have Visio, you can build
a huge organization histogram up to 1000 shapes with a very complex structure. SmartArt
diagrams are much simple and recommended for smaller organizations, but you can add many
visual effects and use Office theming for your organization diagrams. Using Microsoft
Word built-in tools, you can easily create and share functional, divisional, or matrix
org charts. A killer feature of SmartArt graphics templates is that you simply type and
paste the text and the template positions and re-arranges the blocks automatically.
How to create an Arc length chart in PowerPoint
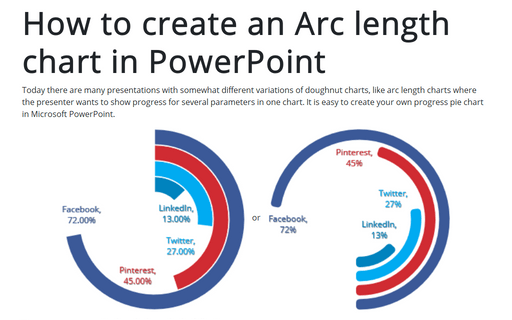
Today there are many presentations with somewhat different variations of doughnut charts, like arc length charts where the presenter wants to show progress for several parameters in one chart. It is easy to create your own progress pie chart in Microsoft PowerPoint.
How to add pictures to vertical axis of the bar chart
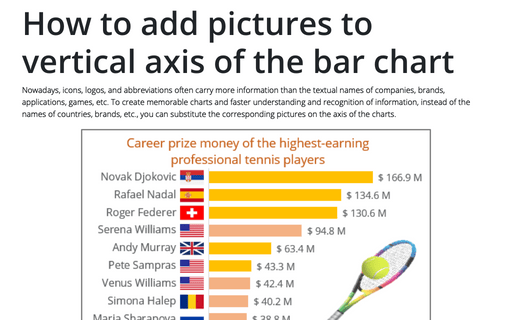
Nowadays, icons, logos, and abbreviations often carry more information than the textual names of companies, brands, applications, games, etc. To create memorable charts and faster understanding and recognition of information, instead of the names of countries, brands, etc., you can substitute the corresponding pictures on the axis of the charts.
Side by side comparison bar chart with differences
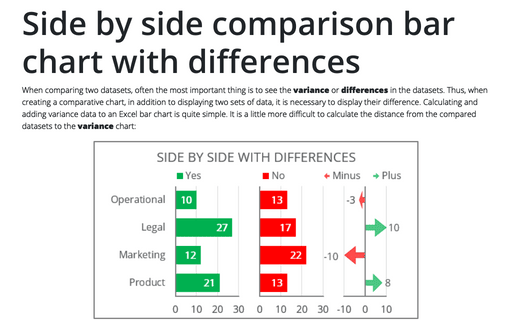
When comparing two datasets, often the most important thing is to see the variance or differences in the datasets. Thus, when creating a comparative chart, in addition to displaying two sets of data, it is necessary to display their difference. Calculating and adding variance data to an Excel bar chart is quite simple. It is a little more difficult to calculate the distance from the compared datasets to the variance chart:
How to create Butterfly chart in Excel
A butterfly chart is a simplified version of a diverging chart, also known as a divergent chart. Unlike a diverging chart, a butterfly chart can only compare two data sets using two horizontal bars with a central baseline.
How to show Likert scale chart with extra neutral
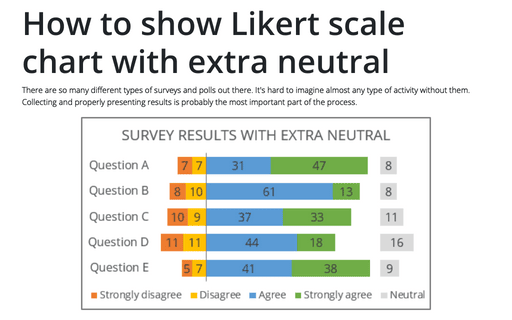
There are so many different types of surveys and polls out there. It's hard to imagine almost any type of activity without them. Collecting and properly presenting results is probably the most important part of the process.
Creating a simple competition chart
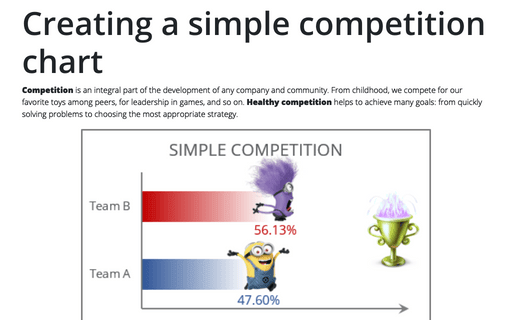
Competition is an integral part of the development of any company and community. From childhood, we compete for our favorite toys among peers, for leadership in games, and so on. Healthy competition helps to achieve many goals: from quickly solving problems to choosing the most appropriate strategy.
