Adding captions with AutoCaption
Many documents contain references to headings, tables, images, equations, etc. It is better to create references to the titles or numbers of these items in the document because you don't need to remember and update them after each change. Let Word makes this routine less painful.
How to add deviations into your chart
Sometimes you can give your charts a more impressive view by showing deviations of some real process from its expected flow.
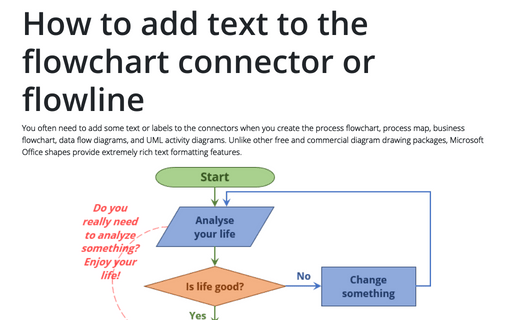
How to add text to the flowchart connector or flowline
You often need to add some text or labels to the connectors when you create the process flowchart, process map, business flowchart, data flow diagrams, and UML activity diagrams. Unlike other free and commercial diagram drawing packages, Microsoft Office shapes provide extremely rich text formatting features.
Custom cell format
Excel includes a variety of built-in formats that cover general, numeric, currency, percentage, exponential, date, time, and custom numeric formats. You can also design custom formats based on one of the built-in formats.
Excel 3-D Pie charts
Pie charts are often used to present various kinds of data. You can create a pie chart in Excel that looks like the ones in popular glossy magazines. In addition, using 3D effects, you can display even not very presentable data colorfully and profitably.
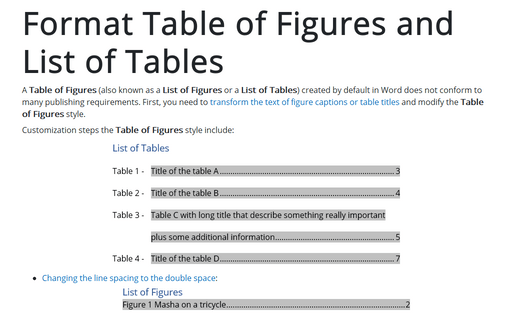
Format Table of Figures and List of Tables
A Table of Figures (also known as a List of Figures or a List of Tables) created by default in Word does not conform to many publishing requirements. First, you need to transform the text of figure captions or table titles and modify the Table of Figures style.
Simple combination chart
Sometimes you want to show a single chart with a series of different chart types. These charts containing data series with different chart types for each of them (lines, columns, areas, scatter, etc.) are called combo or combination charts:
Bubble and Area chart
Combination charts are a great opportunity to create a really creative and memorable data presentation. Unfortunately, you can't choose the Bubble chart as an alternative chart type for line, area, etc. charts in the Change Chart Type dialog box (see Using two axes in the one chart). This tip shows how to combine two different chart types into one chart.
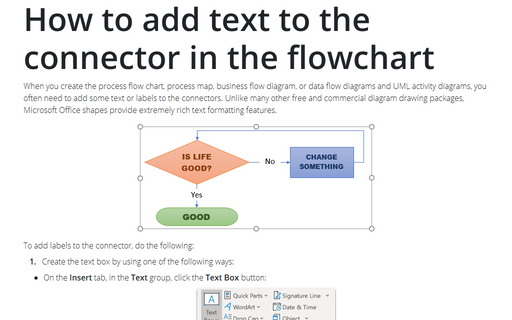
How to add text to the connector in the flowchart
When you create the process flow chart, process map, business flow diagram, or data flow diagrams and UML
activity diagrams, you often need to add some text or labels to the connectors. Unlike many other free and
commercial diagram drawing packages, Microsoft Office shapes provide extremely rich text formatting
features.
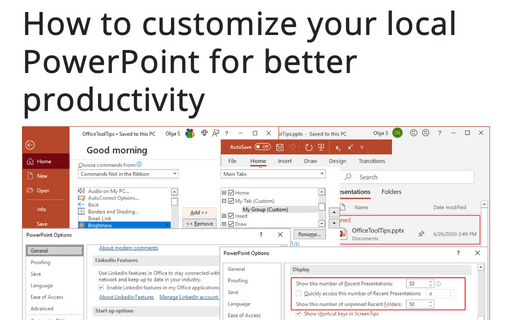
How to customize your local PowerPoint for better productivity
PowerPoint is rarely used by the average Microsoft Office user, but those who use it frequently might find these simple time-saving tips helpful.


