How to add elbow to the table
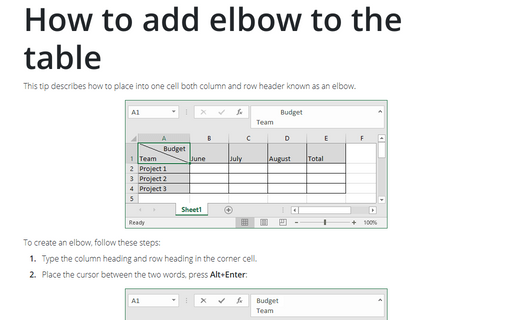
This tip describes how to place into one cell both column and row header known as an elbow.
Modify table structure
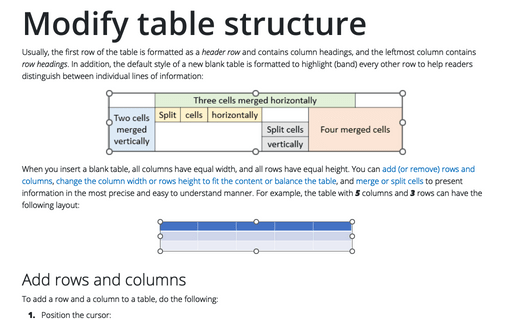
Usually, the first row of the table is formatted as a header row and contains column headings, and the leftmost column contains row headings. In addition, the default style of a new blank table is formatted to highlight (band) every other row to help readers distinguish between individual lines of information:
Highlight data series in line chart
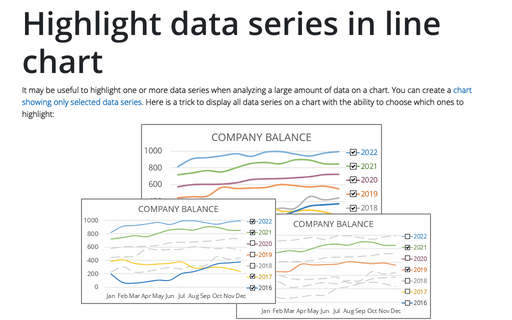
It may be useful to highlight one or more data series when analyzing a large amount of data on a chart. You can create a chart showing only selected data series. Here is a trick to display all data series on a chart with the ability to choose which ones to highlight:
How to add labels to the Mosaic plot
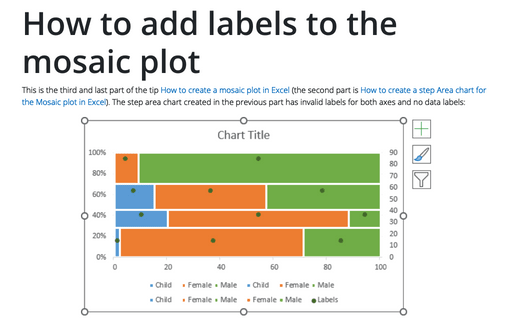
This is the third and last part of the tip How to create a Mosaic plot in Excel (the second part is How to create a step Area chart for the Mosaic plot in Excel). The step area chart created in the previous part has invalid labels for both axes and no data labels:
Formatting table cells in PowerPoint
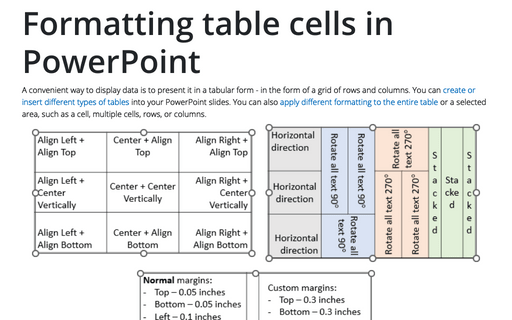
A convenient way to display data is to present it in a tabular form - in the form of a grid of rows and columns. You can create or insert different types of tables into your PowerPoint slides. You can also apply different formatting to the entire table or a selected area, such as a cell, multiple cells, rows, or columns.
Trendlines and Moving Average in Excel
A trend line (or trendline, also known as a line of best fit) is a straight or curved line on a chart that shows a general pattern or the general direction of the data. The trend line displays the approximated values obtained using some mathematical function. The choice of function for constructing a trend line is usually determined by the nature of the data.
How to make and use columns in a Word document
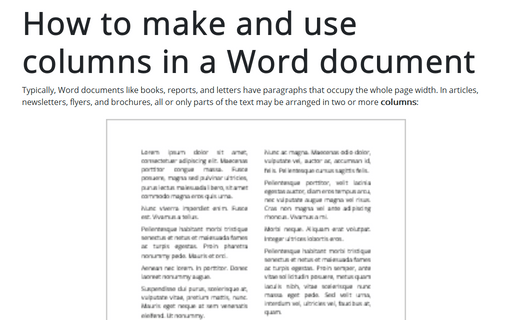
Typically, Word documents like books, reports, and letters have paragraphs that occupy the whole page width. In articles, newsletters, flyers, and brochures, all or only parts of the text may be arranged in two or more columns:
How to select a large data range in one click in Excel
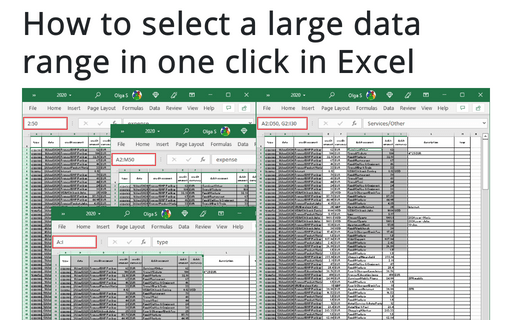
Sometimes you need to select a large data range. This tip shows how to select rows, columns, rectangular, or free form ranges in a few clicks.
How to freeze columns and rows
You can freeze your column and row labels so that you can view them no matter how far you scroll down or to the right in your worksheet.
How to print a large Excel spreadsheet
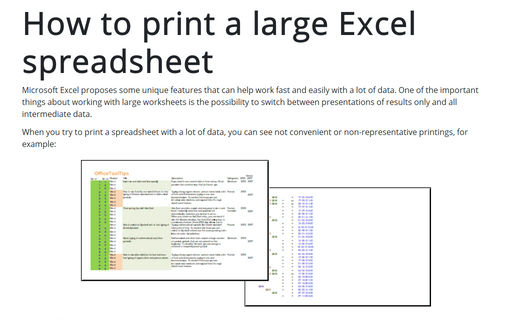
Microsoft Excel proposes some unique features that can help work fast and easily with a lot of data. One of the important things about working with large worksheets is the possibility to switch between presentations of results only and all intermediate data.
