How to create or insert tables in PowerPoint
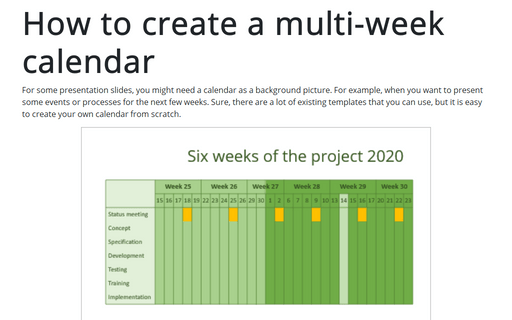
See also how to create a calendar project planning in PowerPoint.
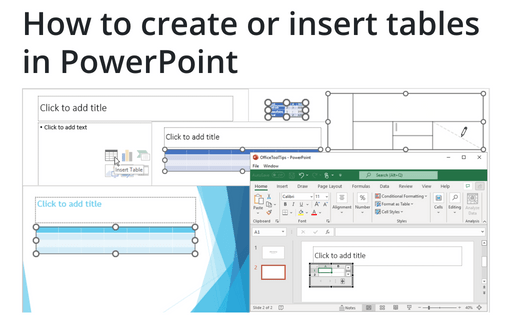
PowerPoint proposes several ways to insert a table:
- Create a table using a content placeholder,
- Create a table of up to 10 columns and 8 rows,
- Create a table with more than 10 columns or more than 8 rows,
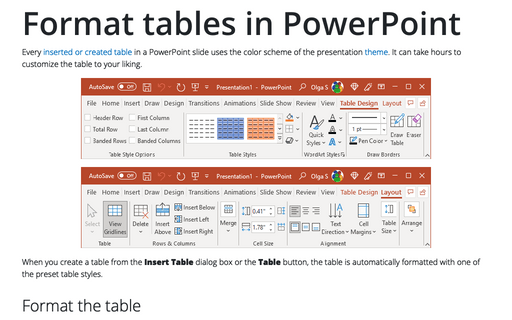
Note: When you create a table using any of the ways above, a new table is automatically formatted with one of the preset table styles - see more about table formatting.
- Draw a table,
- Create an Excel spreadsheet,
- Insert an existing Word or Excel table,
- Paste an existing Word or Excel table as a linked object.
Note: Text from a table does not appear in the Outline view.
Create a table using a placeholder
The simplest way to insert a table is clicking on the Insert Table icon in a content placeholder:

It opens the Insert Table dialog box that proposes you specify the number of columns and rows for a new table:

A new table that fills the placeholder width appears on the slide:

Create a table of up to 10 columns and 8 rows
To create a table of up to 10 columns and 8 rows, do the following:
1. On the Insert tab, in the Tables group, click the Table button.
2. Move the cursor right (to select columns) and down (to select rows) the grid to select as many cells as you need.
E.g., the table of 7 columns and 4 rows (selected cells will turn orange):
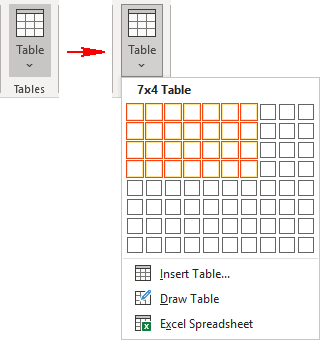
The table appears immediately on the slide as you move the cursor across the grid, so you can see how it will look in real-time.
3. To fix the number of columns and rows for the new table, click the bottom right cell of the selected grid cells.
A new table appears on the slide with the width of the placeholder if a content placeholder is available:

Note: After applying some Themes, the size of such a table changes automatically. For example:

In some cases, it is needed to create a table that is not a part of the layout. For example, if you insert a table with its own size, that should not be changed after applying a Theme (see more about Themes in PowerPoint).
To ensure that the table is not a part of the layout, create it on the slide that doesn't contain a table-compatible placeholder, such as Blank or Title Only (see more about slide layout).
On slides with such layouts, a new table appears in the default position with the default size:

After applying a Theme, the size of the table doesn't change:

Create a table with more than 10 columns or more than 8 rows
To create a table with more than 10 columns or more than 8 rows, do one of the following:
- Create a table with exactly 10 columns or 8 rows, then add as many columns or rows as you need (see below for how to customize the table).
- On the Insert tab, in the Tables group, click the Table button, then select the Insert Table... option:
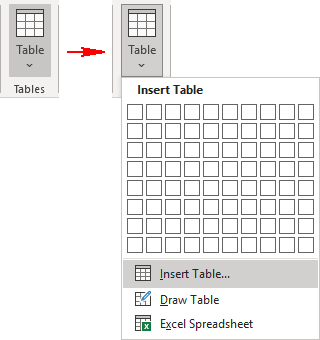
In the Insert Table dialog box, specify the number of columns and rows for a new table:

A new table appears on the slide with the width of the placeholder, if available. A new table appears in the default position with default width and height if there are no placeholders on the slide - see the note above.
Draw a table
To manually create an empty table, on the Inserts tab, in the Tables group, click the Table button, then select Draw Table from the dropdown list:
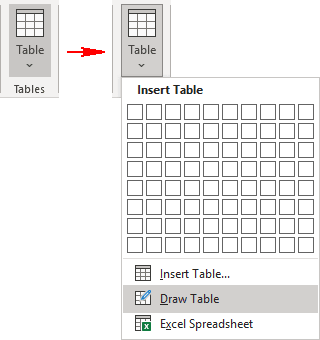
The cursor changes to the pencil ![]() that allows drawing cells directly on the slide:
that allows drawing cells directly on the slide:
1. Hold the mouse button and move the pencil cursor to draw a rectangle that will be the outer frame of a new table:

After releasing the mouse button, the outer frame of a new table appears, and PowerPoint displays the Table Design and Layout tabs:

2. On the Table Design tab, in the Draw Borders group, click the Draw Table button to re-enable the drawing if it is not already enabled:

3. Press the mouse button and move the pencil cursor to draw the desired rows and columns.
When you start moving the cursor vertically or horizontally, PowerPoint tries to keep the line straight and exactly vertical or horizontal, or diagonal between two corners of existing cells.

Note: If you draw a line in the wrong way, click the Eraser button in the Draw Borders group of the Table Design tab to remove it:

4. To stop drawing, do one of the following:
- Click the Draw Table button again,
- Click anywhere on a slide outside the table,
- Press Esc.
We recommend displaying the rulers, gridlines, and guides to help you create the table you need.
Note: If you need a table with a couple of changes, such as a few merged cells or a few extra divisions, it's much easier to create a table using the grid on the Table button or the Insert Table dialog box, then modify it using the Draw Table button and /or the Eraser button on the Table Design tab.
Create a Microsoft Excel spreadsheet in PowerPoint
Very often, PowerPoint slides use a Microsoft Excel spreadsheet. You can insert an existing spreadsheet to your slide or create a new Excel spreadsheet on the slide. The last variant creates a real embedding of Excel cells with Excel calculations instead of creating a PowerPoint table.
To create an Excel spreadsheet on PowerPoint slide, do the following:
1. If needed, select a placeholder into which you need to place Excel cells.
2. On the Insert tab, in the Tables group, click the Table dropdown list, then select Excel Spreadsheet:
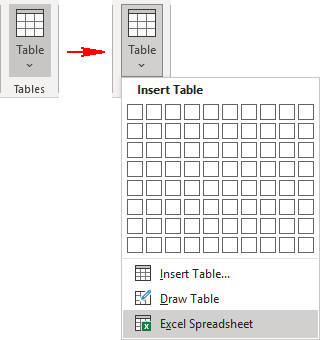
PowerPoint inserts a small frame with a few cells of an Excel spreadsheet and displays the Excel tabs:

3. In the inserted Excel spreadsheet, enter the data, and use Excel features such as functions and formulas to create or manipulate the data.
Notes:
- It is not a PowerPoint table; it is an embedded Excel object that does not exist outside this PowerPoint file.
- To change the Excel table sizes, move black handles around the object:

- PowerPoint inserts only the visible cells from the Excel spreadsheet into the new table. All invisible data is saved, so if you need to hide some data, just select the cells that should be displayed on the PowerPoint slide.
4. To return to PowerPoint, click anywhere on a slide but the table.
An Excel spreadsheet appears:
- In the placeholder on the slide with the size of the placeholder, if available:

- In the center of the slide with its own size and shape used by default in Excel (Calibri 11, see how to change the default font in Excel):

Note: If you change the theme, all such tables will resize to the default Excel sizes:

To make changes in the Excel spreadsheet, double-click on it to open an Excel view with Excel tabs.
Insert an existing Word or Excel tables
If you want to insert an existing Word table or Excel spreadsheet, you can copy and paste it into the slide. PowerPoint can convert the inserted table to a PowerPoint table. After inserting a table, it is no longer a Word or Excel table - it is part of the presentation and is not related to any other application. You can change it directly in PowerPoint.
To paste a table from Word or Excel onto a PowerPoint slide, do the following:
1. Copy an existing table in Word or Excel to the Clipboard. For example, by pressing Ctrl+C.
2. Paste it onto a slide in PowerPoint. For example, by pressing Ctrl+V.
The resulting table appears in the center of the slide (it doesn't depend on existing of any placeholder). The table retains its own size and shape:

Note: When you paste a table from another source onto a slide, PowerPoint shows a Paste Options button that displays a menu of options for pasting the table:

 - Use Destination Styles (S) (default option) applies the fonts, colors, and effects of the slide theme to the table. The table can be modified.
 - Keep Source Formatting (K) retains the original formatting of the table. The table can be modified.
 - Embed (E) inserts an image of the table linked to the source document or workbook. Double-clicking the image opens the source file (if available), where you can change the table content.
 - Picture (U) This option inserts an image of the table onto the slide. The table cannot be modified other than by applying image formatting.
 - Keep Text Only (T) This option inserts unformatted text.
Paste an existing table as a linked object
If you want to insert a table that can be updated in a non-PowerPoint application such as an Excel spreadsheet, do the following:
1. Copy an existing table in Word or Excel to the Clipboard. For example, by pressing Ctrl+C.
2. In PowerPoint, on the Home tab, in the Clipboard group, click the Paste button, then choose Paste Special:
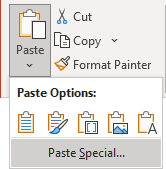
Note: Any other paste option doesn't create a link to the source file, so any changes in the source table don't update the table in PowerPoint.
3. In the Paste Special dialog box, check the Paste link option and click the OK button:

PowerPoint inserts linked Excel and Word tables as separate objects at the center of the slide with their sizes and shapes:

Note: Be careful! PowerPoint inserts the table from Word with page margins, not with table width:

See more about inserting linked objects into PowerPoint to create a dynamic presentation.
Note: Unlike Word, PowerPoint does not support Convert Text to Table functionality. If the slide contains content that you want to display in a table format, you can, for example, copy the text into a document, convert it to a table, and then copy the table to the slide.
