Chart in PowerPoint 2016
How to create a timeline using SmartArt
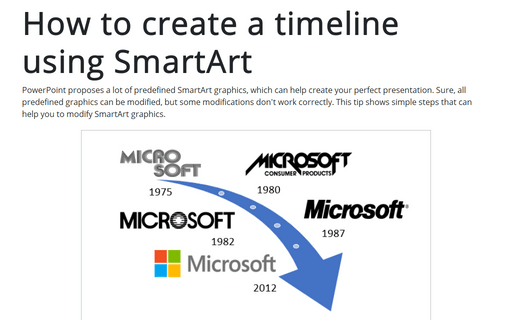
PowerPoint proposes a lot of predefined SmartArt graphics, which can help to create your perfect
presentation. Sure, all predefined graphics can be modified, but some modifications don't work correctly.
This tip shows simple steps that can help you to modify SmartArt graphics.
How to stress cyclic processes using two arrow circle diagram
If you want to stress on the cyclic nature in a diagram, schema or chart will be useful to create circling
arrows or arrows in a circle and use them for the background picture.
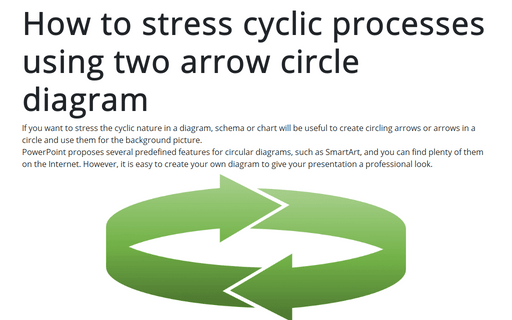
PowerPoint proposes several predefined features for circular diagrams such as SmartArt, and you can find plenty of them on the Internet. However, it is easy to create your own diagram that will give your presentation a professional look.
PowerPoint proposes several predefined features for circular diagrams such as SmartArt, and you can find plenty of them on the Internet. However, it is easy to create your own diagram that will give your presentation a professional look.
How to create a cycle flow chart using four arrows in a circle
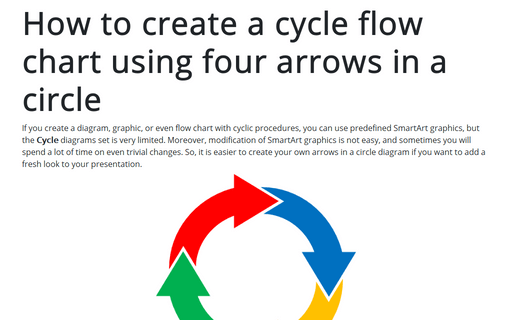
If you create a diagram, graphic, or even flow chart with cyclic procedures, you can use predefined SmartArt
graphics, but Cycle diagrams set is very limited. Moreover, modification of SmartArt graphic is not
easy, and sometimes you will spend a lot of time for even trivial change. So, it is easier to create your own
arrows in a circle diagram if you want to add a fresh look for your presentation.
How to format pictures in organization chart
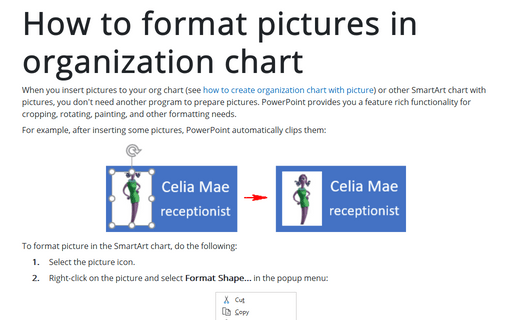
When you insert pictures to your org chart (see how to create organization
chart with picture) or other SmartArt chart with pictures, you don't need another program to prepare
pictures. PowerPoint provides you a feature rich functionality for cropping, rotating, painting, and other
formatting needs.
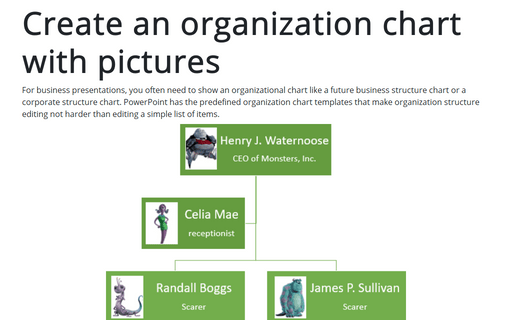
Create an organization chart with pictures
For business presentations, you often need to show an organizational chart like a future business structure
chart or a corporate structure chart. PowerPoint has the predefined organization chart templates that make
organization structure editing not harder than editing a simple list of items.
