Chart in PowerPoint 2016
How to make a splendid circular flow chart
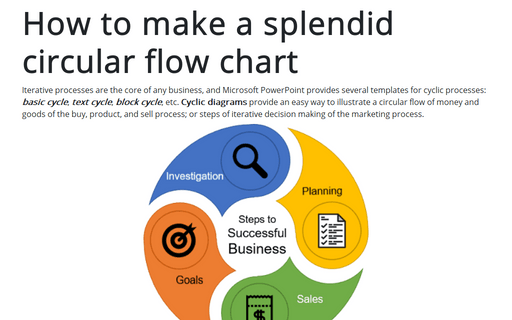
Iterative processes are the core of any business, and Microsoft PowerPoint provides several
templates for cyclic processes: basic cycle, text cycle,
block cycle, etc. Cyclic diagrams provide an easy way to illustrate a
circular flow of money and goods of the buy, product, and sell process; or steps of iterative
decision making of the marketing process.
How to create PowerPoint progress pie chart
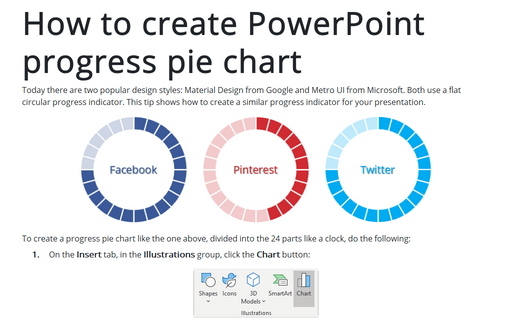
Today there are two popular design styles: Material Design from Google and Metro UI from Microsoft. Both are
using a flat circular progress indicator. This tip shows how to create a similar progress indicator for your
presentation.
How to create full circle progress charts in PowerPoint
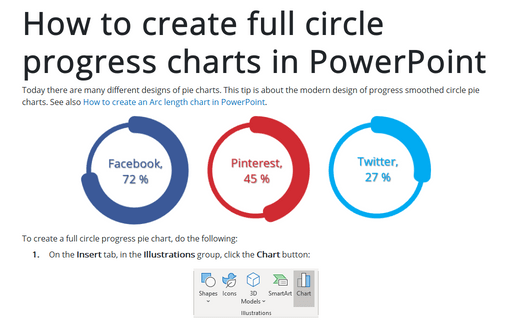
Today there are many different designs of pie charts. This tip is about the modern design of progress
smoothed circle pie charts.
See also How to create an Arc length chart in PowerPoint.
See also How to create an Arc length chart in PowerPoint.
How to create an Arc length chart in PowerPoint
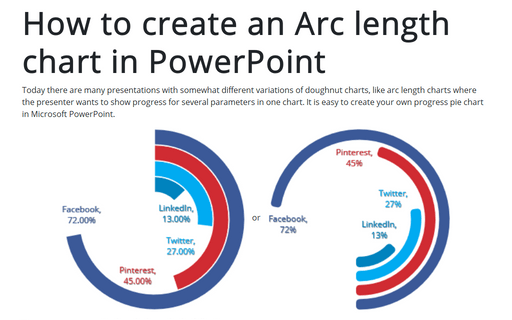
Today there are many presentations with somewhat different variations of doughnut charts, like arc length
chart where the presenter wants to show progress for several parameters in one chart. It is easy to create
your own progress pie chart in Microsoft PowerPoint.
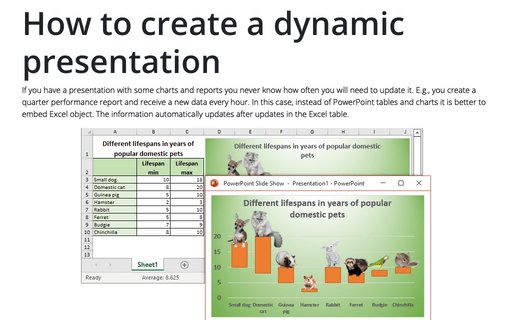
How to create a dynamic presentation
If you have a presentation with some charts and reports you never know how often you will need to update it.
E.g., you create a quarter performance report and receive a new data every hour. In this case, instead of
PowerPoint tables and charts it is better to embed Excel object. The information automatically updates after
updates in the Excel table.
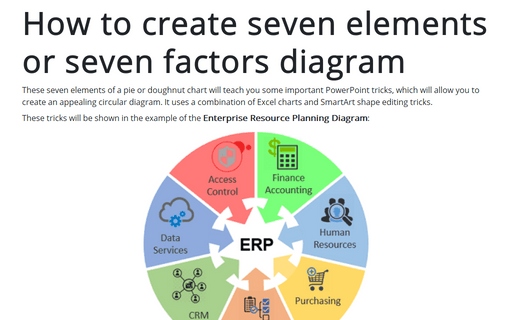
How to create seven elements graph or seven factors diagram
These seven elements of a pie or doughnut chart will teach you some important PowerPoint tricks, which will allow
you to create an appealing circular diagram. It is using a combination of Excel charts and SmartArt shape
editing tricks.
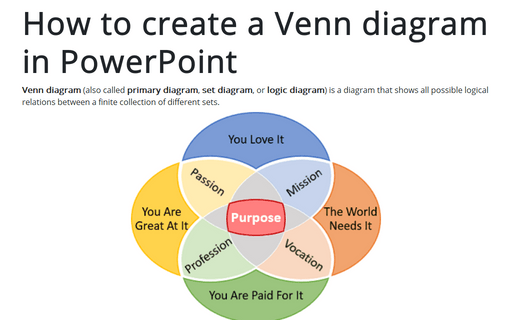
How to create a Venn diagram in PowerPoint
Venn diagram (also called primary diagram, set diagram, or logic diagram) is a
diagram that shows all possible logical relations between a finite collection of different sets.
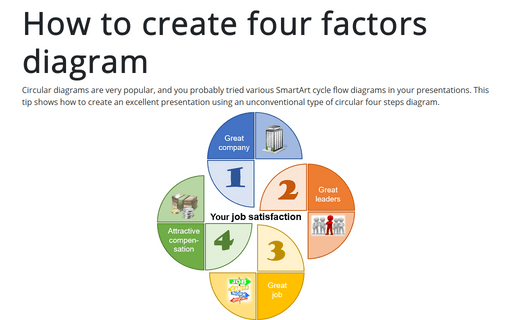
How to create four factors diagram
Circular diagrams are very popular, and you probably tried various SmartArt cycle flow diagrams in your
presentations. This tip shows how to create an excellent presentation using an unconventional type of
circular four steps diagram.
How to create a Jigsaw puzzle chart
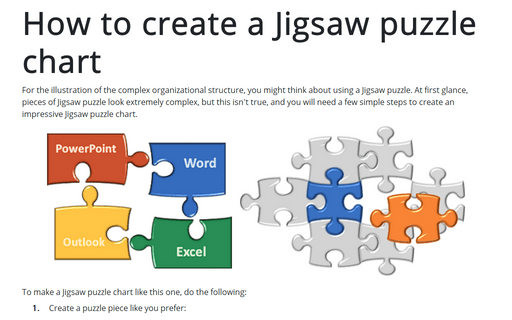
For the illustration of the complex organizational structure, you might think about using a Jigsaw puzzle. At
first glance, pieces of Jigsaw puzzle look extremely complex, but this isn't true, and you will need a few
simple steps to create an impressive Jigsaw puzzle chart.
How to create a timeline in PowerPoint
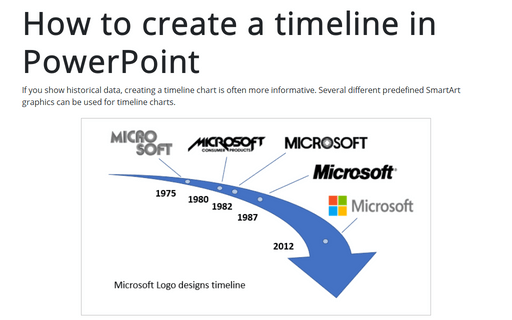
If you show historical data, it is often more informative to create a timeline chart. Several
different predefined SmartArt graphics can be used for timeline charts.
This tip shows simple steps for creating a simple and informative timeline using data for Microsoft logo design changes (see https://en.wikipedia.org/wiki/Microsoft#Logo).
This tip shows simple steps for creating a simple and informative timeline using data for Microsoft logo design changes (see https://en.wikipedia.org/wiki/Microsoft#Logo).
