Object effect types and presets
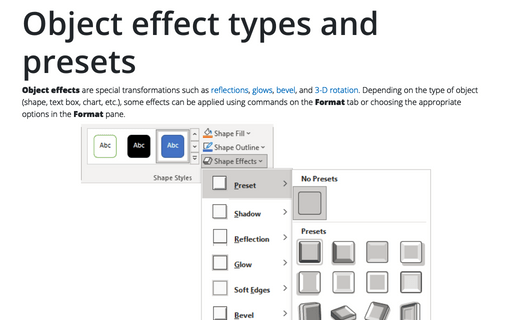
Object effects are special transformations such as reflections, glows, bevel, and 3-D rotation. Depending on the type of object (shape, text box, chart, etc.), some effects can be applied using commands on the Format tab or choosing the appropriate options on the Format pane.
How to create two vertical axes on the same side
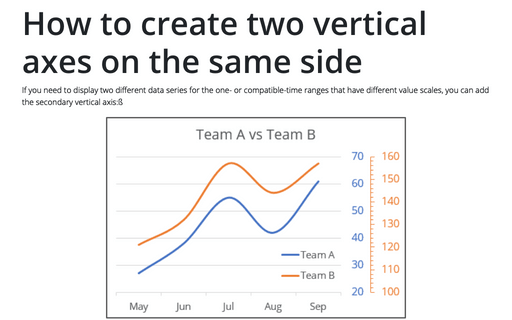
If you need to display two different data series for the one- or compatible-time ranges that have different value scales, you can add the secondary vertical axis:ß
Add radiance and softness to Pictures, Shapes, SmartArt, and Charts in Powerpoint
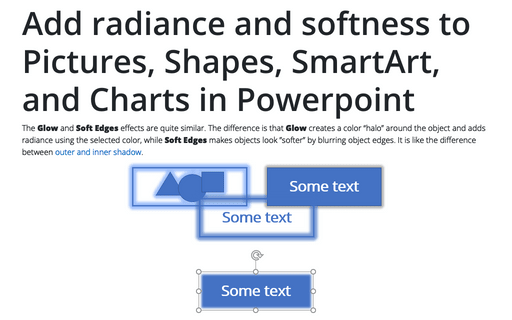
The Glow and Soft Edges effects are quite similar. The difference is that Glow creates a color “halo” around the object and adds radiance using the selected color, while Soft Edges makes objects look ”softer” by blurring object edges. It is like the difference between outer and inner shadow.
How to make a splendid circular flow chart
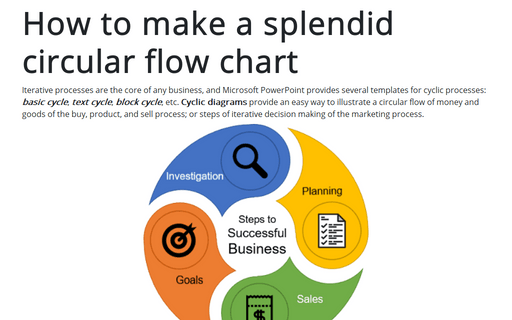
Iterative processes are the core of any business, and Microsoft PowerPoint provides several
templates for cyclic processes: basic cycle, text cycle,
block cycle, etc. Cyclic diagrams provide an easy way to illustrate a
circular flow of money and goods of the buy, product, and sell process; or steps of iterative
decision making of the marketing process.
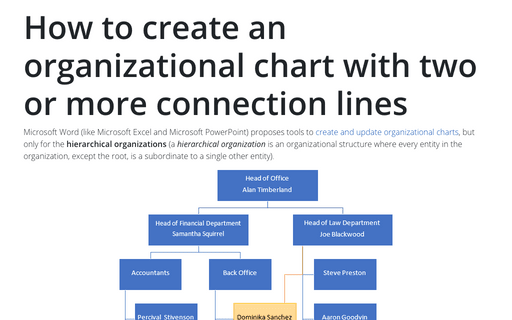
How to create an organizational chart with two or more connection lines
Microsoft Word (like Microsoft Excel and Microsoft PowerPoint) proposes tools to
create and update organizational charts,
but only for the hierarchical organizations. A hierarchical organization is
a tree-like organizational structure where every entity in the organization, except the root, is
subordinate to a single other node, i.e., has only one parent.
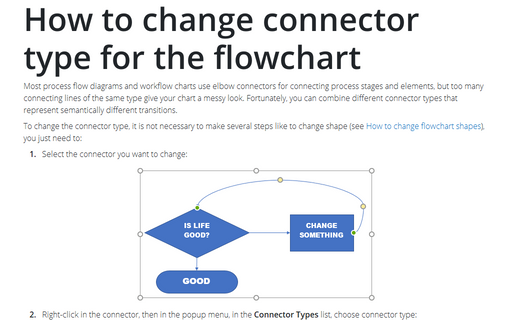
How to change connector type for the flowchart
Most process flow diagrams and workflow charts use elbow connectors for connecting process stages and
elements, but too many connecting lines of the same type give your chart a messy look. Fortunately, you can
combine different connector types that represent semantically different transitions.
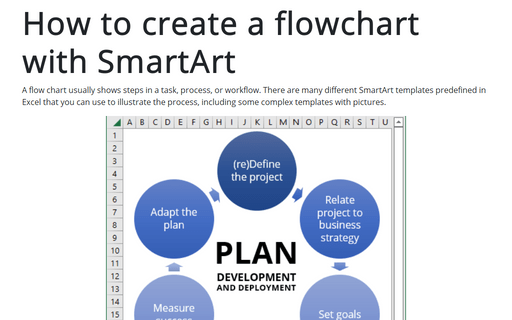
How to create a flowchart with SmartArt
A flow chart usually shows steps in a task, process, or workflow. There are many different SmartArt templates predefined in Excel that you can use to illustrate the process, including some complex templates with pictures.
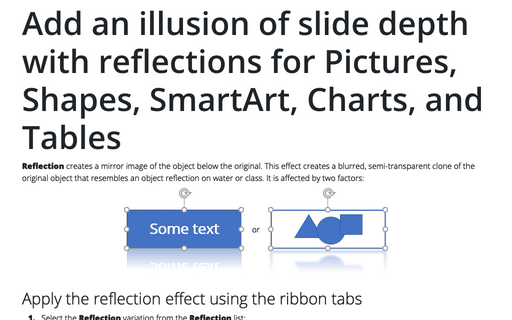
Add an illusion of slide depth with reflections for Pictures, Shapes, SmartArt, Charts, and Tables
Reflection creates a mirror image of the object below the original. This effect creates a blurred, semi-transparent clone of the original object that resembles an object reflection on water or class. It is affected by two factors:
How to create a timeline in PowerPoint
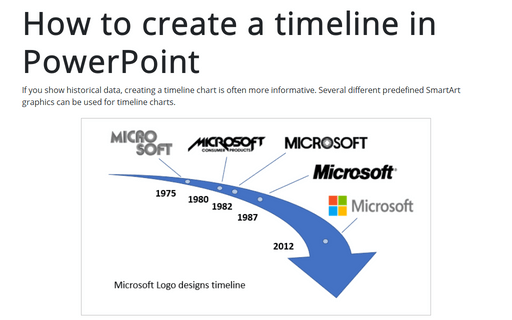
If you show historical data, creating a timeline chart is often more informative. Several different predefined SmartArt graphics can be used for timeline charts.
This tip shows simple steps for creating a simple and informative timeline using Microsoft logo design changes (see https://en.wikipedia.org/wiki/Microsoft#Logo).
This tip shows simple steps for creating a simple and informative timeline using Microsoft logo design changes (see https://en.wikipedia.org/wiki/Microsoft#Logo).
Calendar project planning in PowerPoint
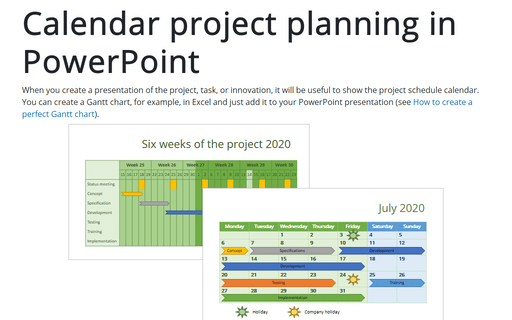
When you create a presentation of the project, task, or innovation, it will be useful to show the project schedule calendar. You can create a Gantt chart, for example, in Excel and just add it to your PowerPoint presentation (see How to create a perfect Gantt chart).
