Adding shapes into an Organizational Chart
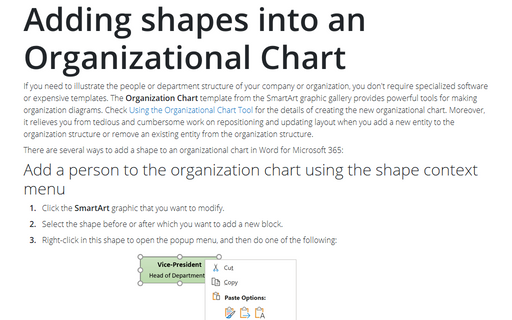
If you need to illustrate the people or department structure of your company or organization, you
don't require specialized software or expensive templates. The Organization Chart template
from the SmartArt graphic gallery provides powerful tools for making organization diagrams.
Check
Using the Organizational Chart Tool
for the details of creating the new organizational chart.
How to reassign a shape in the organizational chart
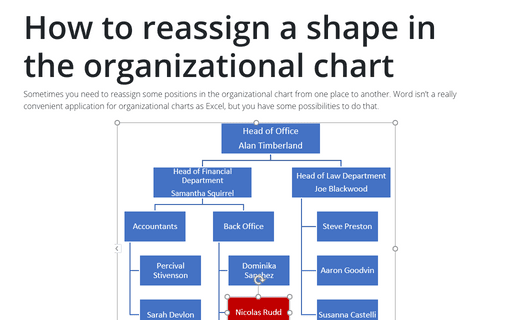
Sometimes you need to reassign some positions in the organizational chart from one place to another.
Word isn't a really convenient application for organizational charts as Excel, but you have some
possibilities to do that.
Object effect types and presets
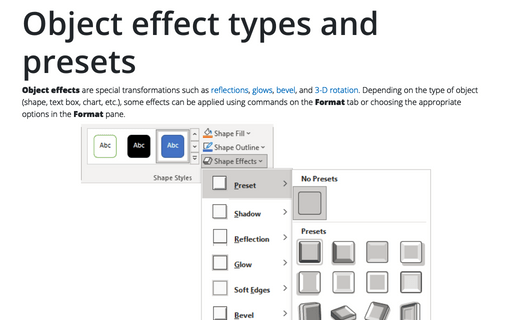
Object effects are special transformations such as reflections, glows, bevel, and 3-D rotation. Depending on the type of object (shape, text box, chart, etc.), some effects can be applied using commands on the Format tab or choosing the appropriate options on the Format pane.
WordArt
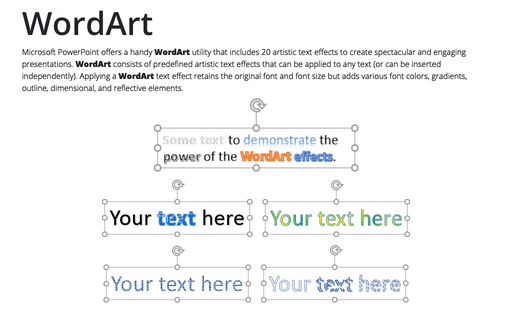
Microsoft PowerPoint offers a handy WordArt utility that includes 20 artistic text effects to create spectacular and engaging presentations. WordArt consists of predefined artistic text effects that can be applied to any text (or can be inserted independently). Applying a WordArt text effect retains the original font and font size but adds various font colors, gradients, outline, dimensional, and reflective elements.
How to format pictures in organization chart
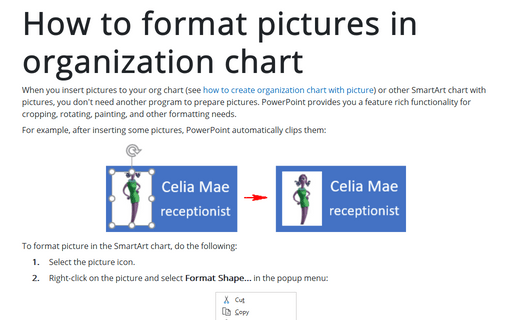
When you insert pictures to your org chart (see how to create organization chart with picture) or other SmartArt chart with pictures, you don't need another program to prepare pictures. PowerPoint provides you a feature rich functionality for cropping, rotating, painting, and other formatting needs.
How to create a cycle flow chart using four arrows in a circle
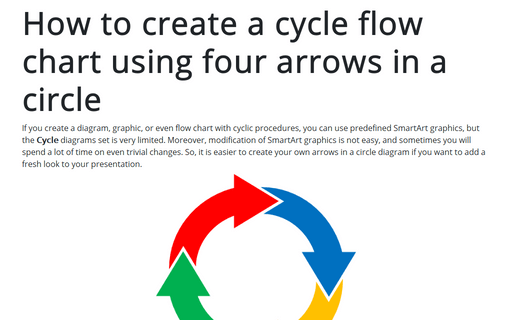
If you create a diagram, graphic, or even flow chart with cyclic procedures, you can use predefined SmartArt graphics, but the Cycle diagrams set is very limited. Moreover, modification of SmartArt graphics is not easy, and sometimes you will spend a lot of time on even trivial changes. So, it is easier to create your own arrows in a circle diagram if you want to add a fresh look to your presentation.
How to create a timeline in PowerPoint
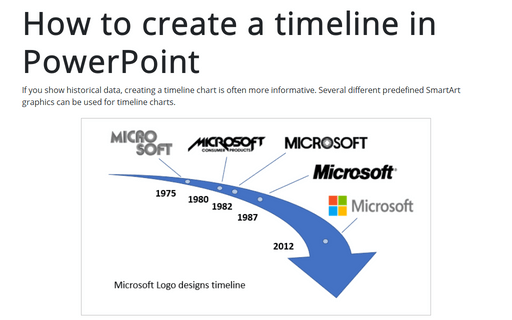
If you show historical data, creating a timeline chart is often more informative. Several different predefined SmartArt graphics can be used for timeline charts.
This tip shows simple steps for creating a simple and informative timeline using Microsoft logo design changes (see https://en.wikipedia.org/wiki/Microsoft#Logo).
This tip shows simple steps for creating a simple and informative timeline using Microsoft logo design changes (see https://en.wikipedia.org/wiki/Microsoft#Logo).
How to create four factors diagram
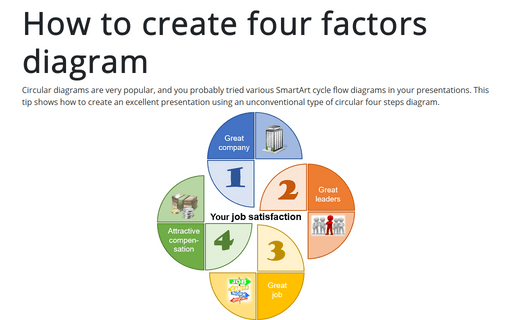
Circular diagrams are very popular, and you probably tried various SmartArt cycle flow diagrams in your presentations. This tip shows how to create an excellent presentation using an unconventional type of circular four steps diagram.
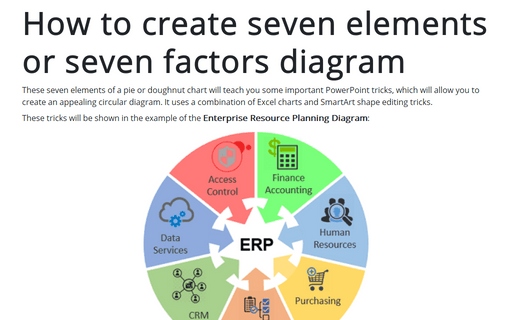
How to create seven elements graph or seven factors diagram
These seven elements of a pie or doughnut chart will teach you some important PowerPoint tricks, which will allow you to create an appealing circular diagram. It uses a combination of Excel charts and SmartArt shape editing tricks.
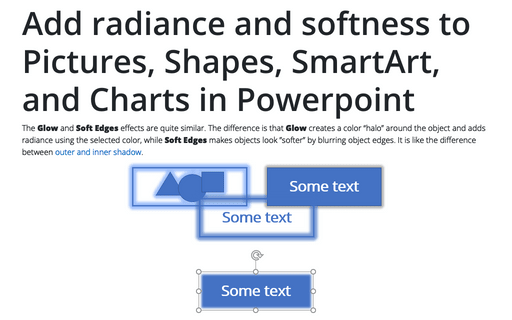
Add radiance and softness to Pictures, Shapes, SmartArt, and Charts in Powerpoint
The Glow and Soft Edges effects are quite similar. The difference is that Glow creates a color “halo” around the object and adds radiance using the selected color, while Soft Edges makes objects look ”softer” by blurring object edges. It is like the difference between outer and inner shadow.
