Add an illusion of slide depth with reflections for Pictures, Shapes, SmartArt, Charts, and Tables
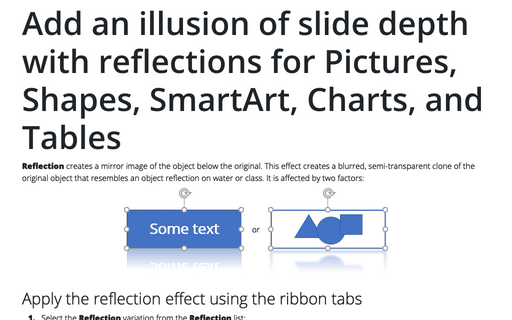
Reflection creates a mirror image of the object below the original. This effect creates a blurred, semi-transparent clone of the original object that resembles an object reflection on water or class. It is affected by two factors:
How to create a timeline in PowerPoint
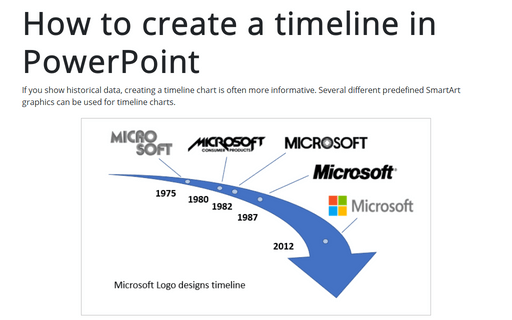
If you show historical data, creating a timeline chart is often more informative. Several different predefined SmartArt graphics can be used for timeline charts.
This tip shows simple steps for creating a simple and informative timeline using Microsoft logo design changes (see https://en.wikipedia.org/wiki/Microsoft#Logo).
This tip shows simple steps for creating a simple and informative timeline using Microsoft logo design changes (see https://en.wikipedia.org/wiki/Microsoft#Logo).
Calendar project planning in PowerPoint
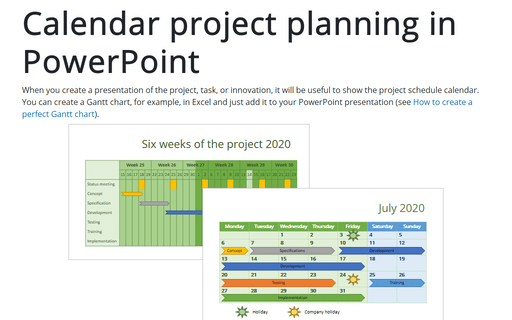
When you create a presentation of the project, task, or innovation, it will be useful to show the project schedule calendar. You can create a Gantt chart, for example, in Excel and just add it to your PowerPoint presentation (see How to create a perfect Gantt chart).
How to create a flowchart in Word
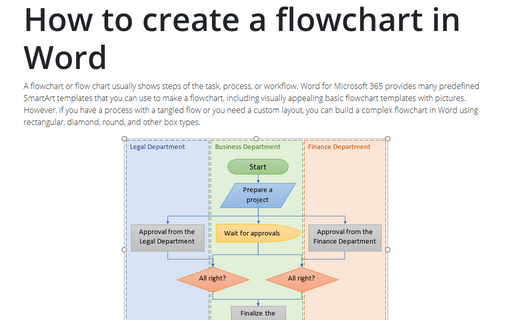
A flowchart or flow chart usually shows steps of the task, process, or workflow.
Word for Microsoft 365 provides many predefined SmartArt templates that you can use to make a flowchart,
including visually appealing basic flowchart templates with pictures. However, if you have a
process with a tangled flow or you need a custom layout, you can build a complex flowchart
in Word using rectangular, diamond, round, and other box types.
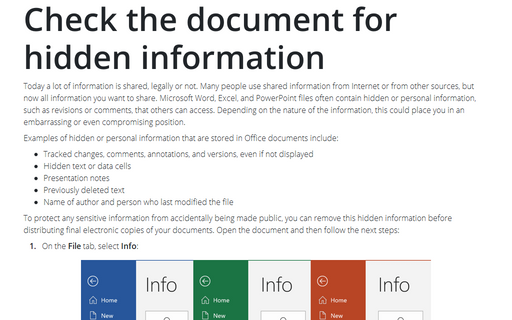
Check the document for hidden information
Today a lot of information is shared, legally or not. Many people use shared information from Internet or
from other sources, but now all information you want to share. Microsoft Word, Excel, and PowerPoint files
often contain hidden or personal information, such as revisions or comments, that others can access.
Depending on the nature of the information, this could place you in an embarrassing or even compromising
position.
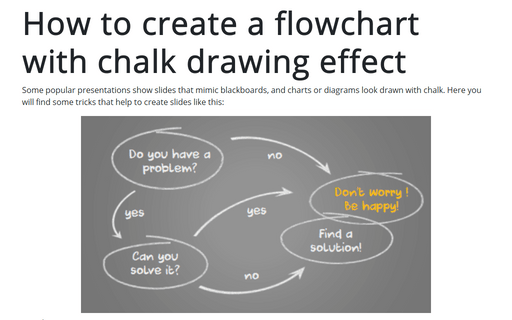
How to create a flowchart with chalk drawing effect
Some popular presentations show slides that mimic blackboards, and charts or diagrams look drawn with chalk. Here you will find some tricks that help to create slides like this:
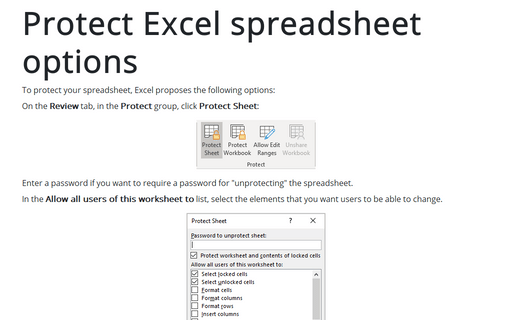
Protect Excel spreadsheet options
To protect your spreadsheet, Excel proposes the following options:
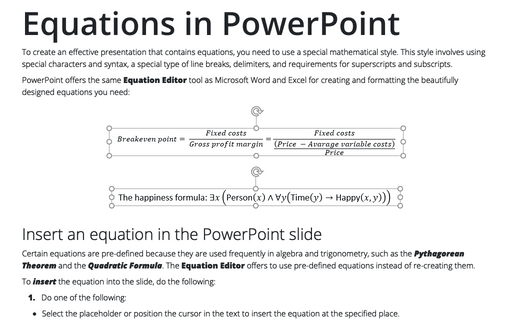
Equations in PowerPoint
To create an effective presentation that contains equations, you need to use a special mathematical style. This style involves using special characters and syntax, a special type of line breaks, delimiters, and requirements for superscripts and subscripts.
Protecting workbook elements
Protecting a workbook is different from protecting the Excel file with a password to prevent reading/writing or locking the spreadsheet elements to prevent editing. Workbook protection forbids other users to add, move, rename or delete worksheets and defends against viewing hidden worksheets or hiding worksheets.
Changing a spreadsheet tabs color
Color code is a perfect way to identify content and draw attention to it. In Excel, you can easily change the colors of one or more spreadsheet tabs (see how to group multiple sheets).
