Creating Pie of Pie and Bar of Pie charts
Excel pie charts are useful for presenting parts of a whole by splitting a circle into sections. Each section looks like a slice of a pie and represents a category. Such a layout makes it easy to observe relationships between the parts, but the smaller the slice becomes (less than 10%), the more difficult it is to estimate visually.
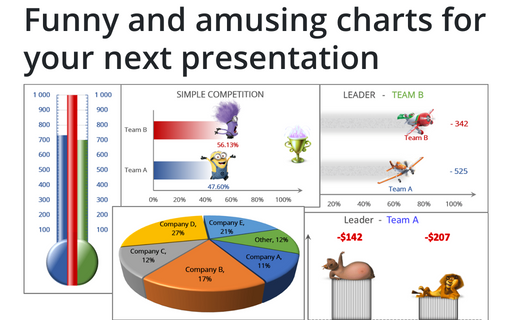
Funny and amusing charts for your next presentation
Several different Excel features can make your presentation less boring:
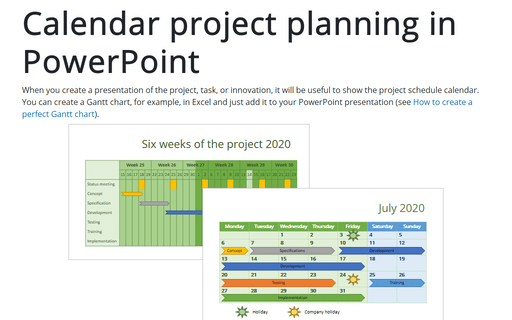
Calendar project planning in PowerPoint
When you create a presentation of the project, task, or innovation, it will be useful to show the project schedule calendar. You can create a Gantt chart, for example, in Excel and just add it to your PowerPoint presentation (see How to create a perfect Gantt chart).
Using shortcut keys to create a chart
Excel proposes an easy and very fast way to create a chart by using shortcut keys.
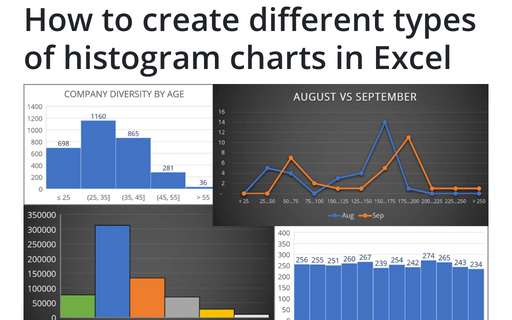
How to create different types of histogram charts in Excel
A histogram chart visualizes the distribution of continuous data. Each column in the histogram chart represents the frequency (amount) of the data within the specific range.
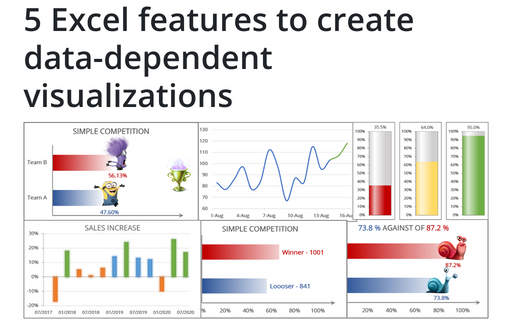
5 Excel features to create data-dependent visualizations
There are several useful features in Excel that can help to create your charts, which automatically change visual appearance depending on data.
How to select an invisible element in the chart
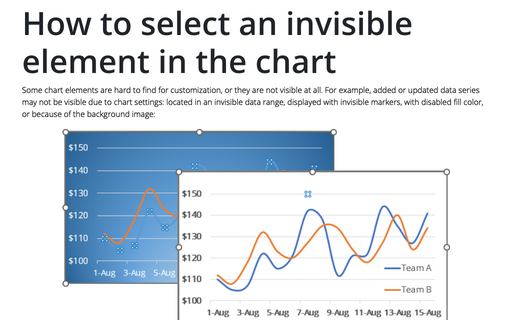
Some chart elements are hard to find for customization, or they are not visible at all. For example, added or updated data series may not be visible due to chart settings: located in an invisible data range, displayed with invisible markers, with disabled fill color, or because of the background image:
How to fix the chart data
You can unlink a chart from its data ranges and produce a static chart that remains unaffected by later changes in the data.
How to create simple diverging bar chart
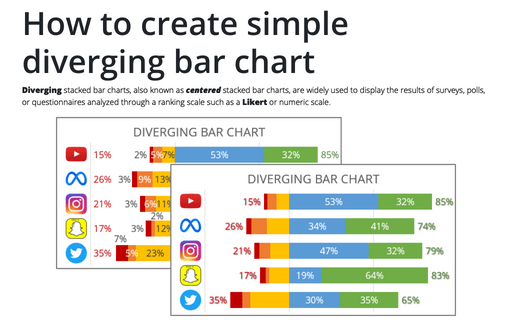
Diverging stacked bar charts, also known as centered stacked bar charts, are widely used to display the results of surveys, polls, or questionnaires analyzed through a ranking scale such as a Likert or numeric scale.
How to create a histogram chart by category using frequencies in Excel
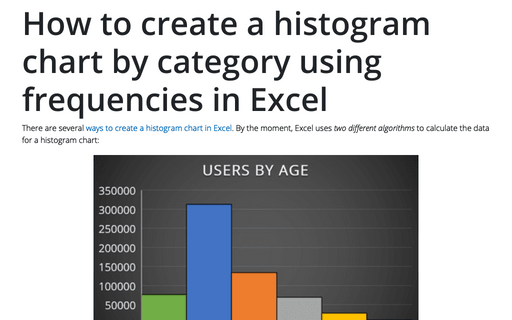
There are several ways to create a histogram chart in Excel. By the moment, Excel uses two different algorithms to calculate the data for a histogram chart:

