How to add pictures to vertical axis of the bar chart
Nowadays, icons, logos, and abbreviations often carry more information than the textual names of companies, brands, applications, games, etc. To create memorable charts and faster understanding and recognition of information, instead of the names of countries, brands, etc., you can substitute the corresponding pictures on the axis of the charts.
Conditional formatting for chart axes
One of the useful tricks to attain the attention of the audience and improve the effect of presenting your data is to use axis label formatting customized for the specific value ranges:
How to change width of gridlines in Excel
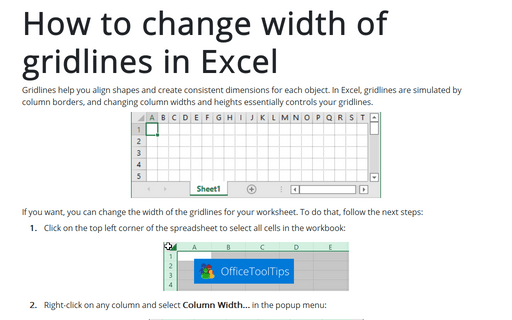
Gridlines help you align shapes and create consistent dimensions for each object. In Excel, gridlines are simulated by column borders, and changing column widths and heights essentially controls your gridlines.
How to create a Marimekko chart or Mekko chart in Excel
The distribution of market shares or stocks of the investment portfolio often is illustrated
by pie or doughnut charts. The illustration of multi-market shares and multiple investment
portfolios calls for different approaches. The Marimekko chart (also known as
Mekko chart, or mosaic plot) comes to the rescue.
How to create simple interactive chart with radio or option buttons
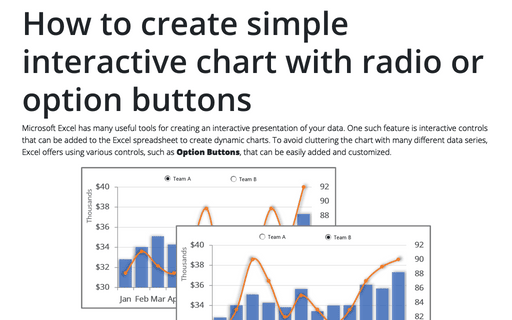
Microsoft Excel has many useful tools for creating an interactive presentation of your data. One such feature is interactive controls that can be added to the Excel spreadsheet to create dynamic charts. To avoid cluttering the chart with many different data series, Excel offers using various controls, such as Option Buttons, that can be easily added and customized.
Adding error bars
For certain chart types, you can add error bars to your chart. Error bars often are used to indicate "plus or minus" information that reflects uncertainty in the data.
Add and remove columns in Outlook
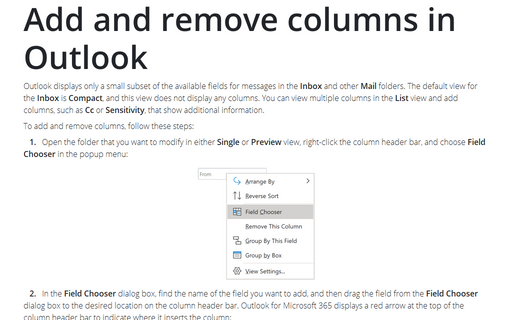
Outlook displays only a small subset of the available fields for messages in the Inbox and other
Mail folders. The default view for the Inbox is Compact, and this view does not display
any columns. You can view multiple columns in the List view and add columns, such as Cc or
Sensitivity, that show additional information.
Print column headers or spreadsheet labels on every page
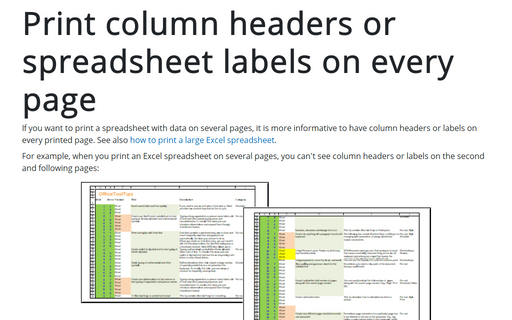
If you want to print a spreadsheet with data on several pages, it is more informative to have column headers or labels on every printed page. See also how to print a large Excel spreadsheet.
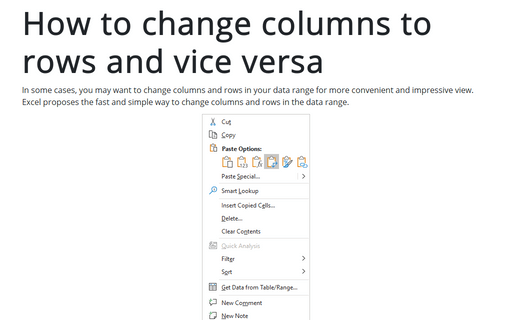
How to change columns to rows and vice versa
In some cases, you may want to change columns and rows in your data range for a more convenient and impressive view. Excel proposes a fast and simple way to change columns and rows in the data range.
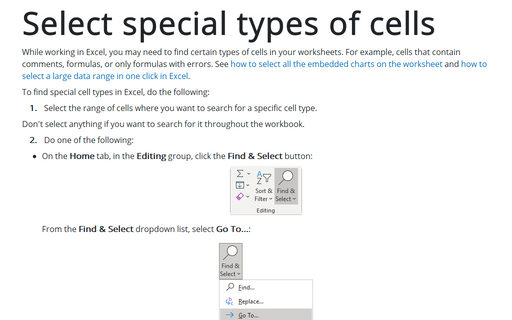
Select special types of cells
While working in Excel, you may need to find certain types of cells in your worksheets. For example, cells that contain comments, formulas, or only formulas with errors. See how to select all the embedded charts on the worksheet and how to select a large data range in one click in Excel.


