Change shape, diagram, text box and chart lines and borders in Powerpoint
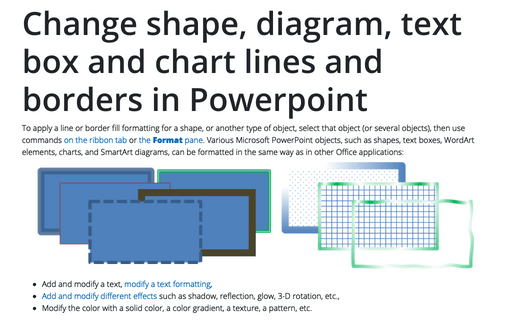
To apply a line or border fill formatting for a shape, or another type of object, select that object (or several objects), then use commands on the ribbon tab or the Format pane. Various Microsoft PowerPoint objects, such as shapes, text boxes, WordArt elements, charts, and SmartArt diagrams, can be formatted in the same way as in other Office applications:
Add and modify shadows for Pictures, Shapes, SmartArt, Charts, and Tables in Powerpoint
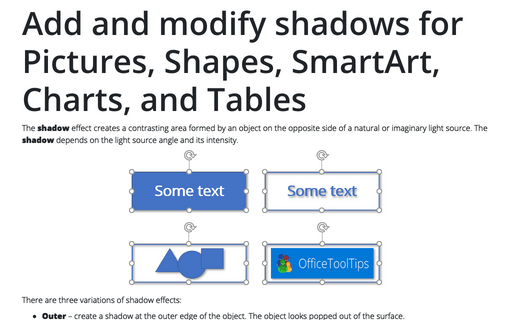
The shadow effect creates a contrasting area formed by an object on the opposite side of a natural or imaginary light source. The shadow depends on the light source angle and its intensity.
Fill Settings for Shapes, Diagrams, Text Boxes and Charts in Powerpoint
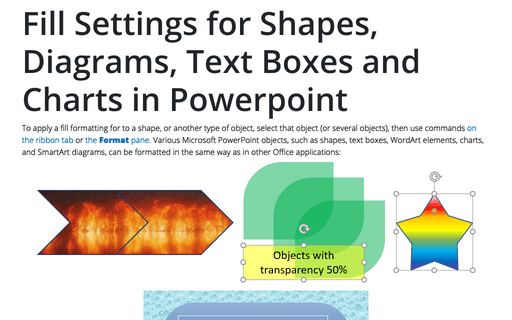
To apply a fill formatting for to a shape, or another type of object, select that object (or several objects), then use commands on the ribbon tab or the Format pane. Various Microsoft PowerPoint objects, such as shapes, text boxes, WordArt elements, charts, and SmartArt diagrams, can be formatted in the same way as in other Office applications:
Change the page orientation
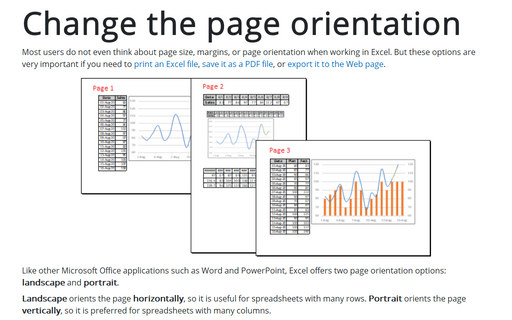
Most users do not even think about page size, margins, or page orientation when working in Excel. But these options are very important if you need to print an Excel file, save it as a PDF file, or export it to the Web page.
Show the Developer tab
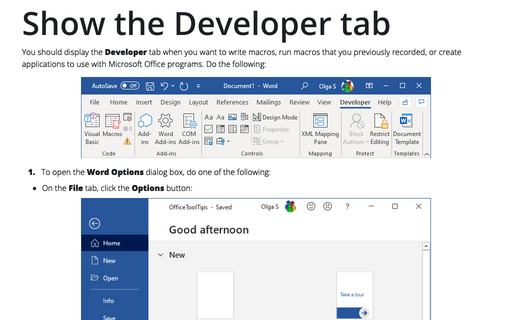
You should display the Developer tab when you want to write macros, run macros that you previously
recorded, or create applications to use with Microsoft Office programs. Do the following:
How to insert cell content to the shape
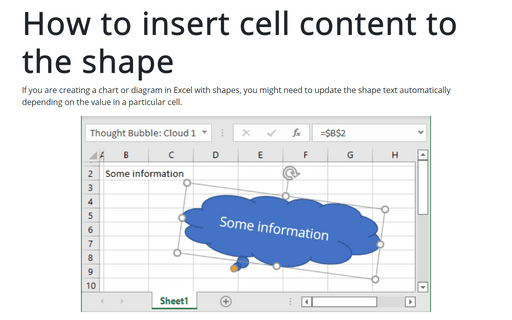
If you create a chart or diagram in Excel with shapes, you might need to update the shape text automatically depending on the value in a particular cell.
How to count days of week in the range of dates
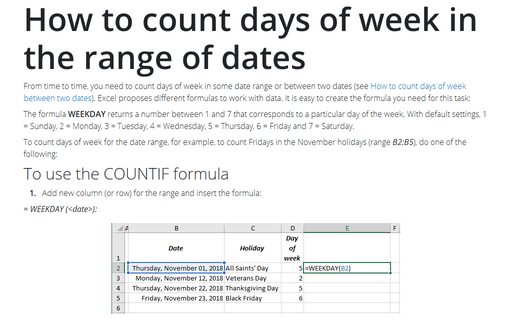
From time to time, you need to count days of week in some date range or between two dates (see How to count days of week between two dates). Excel proposes different formulas to work with data. It is easy to create the formula you need for this task:
Viewing a worksheet in multiple windows
When working with multiple tables and large amounts of data, when designing or analyzing charts or diagrams, you may need to view two or more parts of the worksheet simultaneously.
How to update or change links to Excel charts or spreadsheet data in PowerPoint
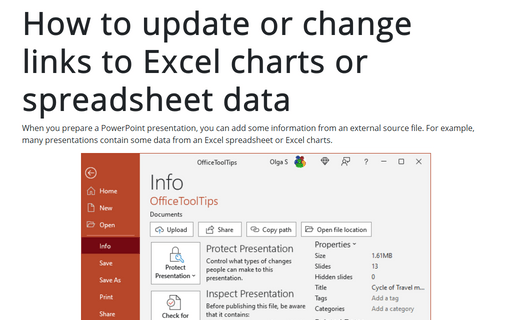
When you prepare a PowerPoint presentation, you can add some information from an external source file. For example, many presentations contain some data from an Excel spreadsheet or Excel charts.
How to create an equilateral triangle, a regular square, and other regular polygons in Excel
For some charts or diagrams, you need to create a regular polygon – equiangular
(all angles are equal) or equilateral (all sides have the same length).
E.g., equilateral triangle, regular square, etc.
