Progressively create a Gantt chart in Excel
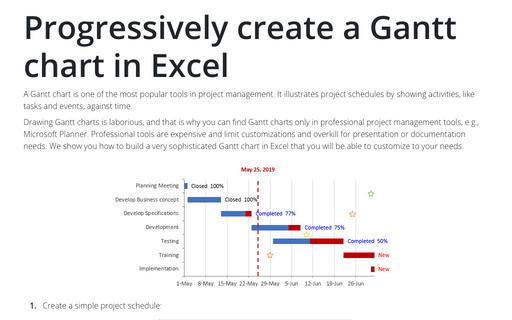
Drawing Gantt charts is laborious, and that is why you can find Gantt charts only in professional project management tools, e.g., Microsoft Planner. Professional tools are expensive and limit customizations and overkill for presentation or documentation needs. We show you how to build a very sophisticated Gantt chart in Excel that you will be able to customize to your needs.
1. Create a simple project schedule:

and do a few customizations to Stacked Bar chart to create a simple Gantt chart:

2. Add the % Complete, Days Complete, and Days Remaining columns to the project schedule:

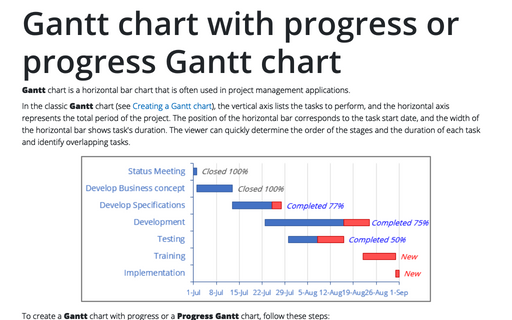
and rebuild your Stacked Bar chart to create a Gantt chart with progress status:

3. Add an events table to the Excel spreadsheet:

and change the Stacked Bar to a combination chart to add events to your schedule:

4. Add the current or a custom date cell to your table:

and add a secondary axis for a vertical line that tracks today's date:

Do any color, shape, or font changes that suit personal taste or company guidelines.

