Show chart data for empty cells
Excel
2016
When you have some gaps in your chart data, Excel doesn't show any data for these gaps and your chart
looks odd. Instead you can show interpolated values instead of gaps in the chart.
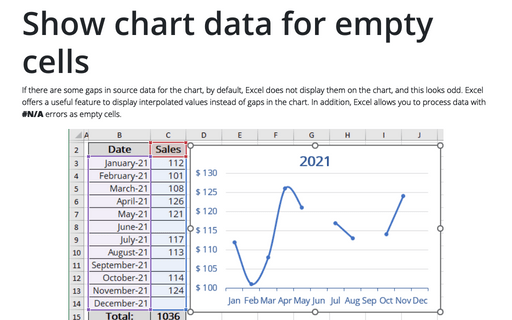
For example, there are some gaps or empty cells in the chart data table:

If you want to see average values in the chart, do the following:
1. Select the chart data by doing one of the following:
- Under Chart Tools, on the Design tab, in the Data group, choose Select Data:

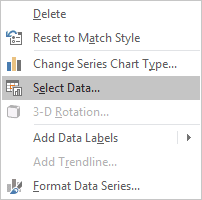
- Right-click in the chart area and choose Select Data... in the popup menu:

2. On the Select Data Source dialog box, click the Hidden and Empty Cells button:

3. On the Hidden and Empty Cell Settings dialog box, in the Show empty cell as radio button groups, select Connect data points with line:

Excel will "show" all empty data on your chart:

See also this tip in French: Afficher les données du graphique pour les cellules vides.

