Creating picture charts


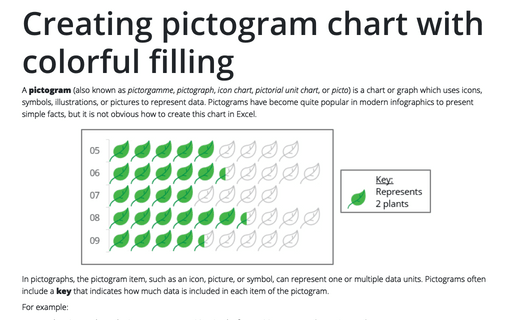
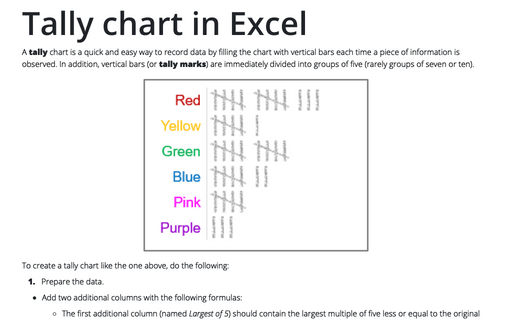
This chart type is called pictogram (also known as icon chart, pictograph, pictorial unit chart or picto) - a chart or graph that uses icons, symbols, or pictures to represent data. See also how to create a pictogram with a colorful effect.
Insert a picture into the data series
Excel offers many different tools to simplify creating impressive charts and diagrams. Fill the data series or just some data points with one icon, symbol, or picture, or use an image as texture (see examples below).
To convert a data series to pictures, follow these steps:
1. Start with a column or bar chart (either standard or 3-D):
On the Insert tab, in the Charts group, click the Insert Bar or Column Chart button:

Choose the chart you prefer.
2. Select the data series (or data point), then do one of the following:
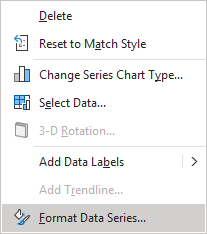
- Right-click on the selection and choose Format Data Series... in the popup menu:
- On the Chart Format tab, in the Current Selection group, click the Format Selection icon:

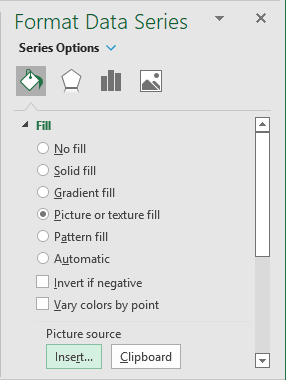
3. On the Format Data Series pane, on the Series Options tab, in the Fill &Line group, in the Fill section:
- Choose Picture or texture fill,
- Click the Insert... button:
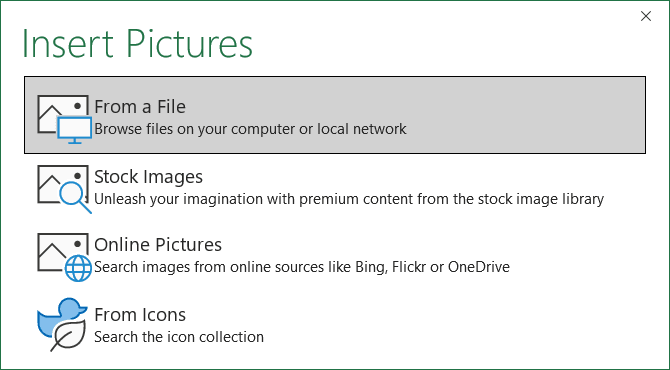
In the Insert Pictures dialog box, choose the picture location, select the picture file, and then click Open or Insert:
- Choose one of the following options:

- The Stretch option (usually the default option) stretches the picture to the height of the data area. E.g.:

Additionally, for this parameter, you can set offset values to position the picture exactly where you want:

- The Stack option formats the picture to stack (in other words, repeat) the width of the data area. E.g.:

- The Stack and Scale with option adjusts the scale of the stacked pictures using the Units/Picture value:

- The Stretch option (usually the default option) stretches the picture to the height of the data area. E.g.:
Remove a picture from the data series
If you want to remove the images for the data series, don't try to delete the image using the Delete button - it will delete the data series or data point area!
To remove the image for the data series or data point, select it and do one of the following:
- Right-click on the selection and choose Format ***... in the popup menu.
On the Format *** pane, in the Fill & Line group, select one of the filling options, e.g., Solid fill or Automatic.
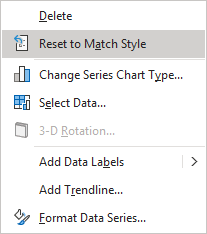
- Right-click on the selection and choose Reset to Match Style in the popup menu:
- On the Chart Format tab, in the Current Selection group, click the Reset to Match Style button:

This command returns the selection to its original fill effects.
See also this tip in French: Comment créer un graphique d'image.

