Creating a gauge chart
A gauge, dial, or speedometer chart displays a value between 0 and 100%. Where the Goal is 100%, and the displayed value is a fraction of the Goal. The actual value can be displayed as a percentage or as a number:
Power trend equation and forecast
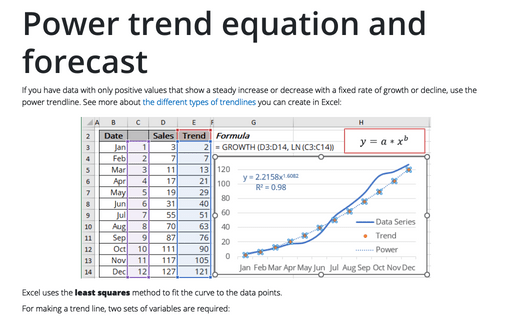
If you have data with only positive values that show a steady increase or decrease with a fixed rate of growth or decline, use the power trendline. See more about the different types of trendlines you can create in Excel:
Exponential trend equation and forecast
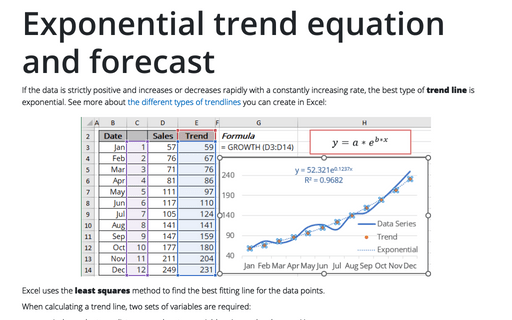
If the data is strictly positive and increases or decreases rapidly with a constantly increasing rate, the best type of trend line is exponential. See more about the different types of trendlines you can create in Excel:
Using a form for data entry
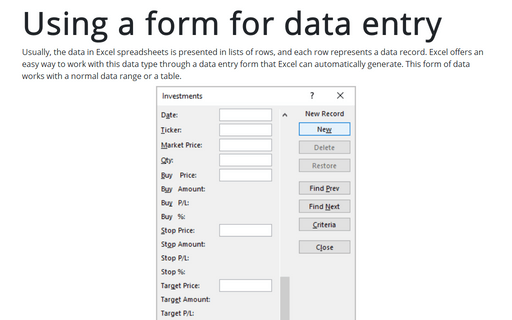
Usually, the data in Excel spreadsheets is presented in lists of rows, and each row represents a data record. Excel offers an easy way to work with this data type through a data entry form that Excel can automatically generate. This form of data works with a normal data range or a table.
Combining text and formatted values
The Excel TEXT function enables you to specify numbers and date format.
Excel for SEO: Best Practices & Formulas Tips
When people first get into SEO, most go straight to discovering niche-specific tools that can help with research and track their performance. There is nothing wrong with this approach, but what will you do with all the data you collect? A logical thing would be to combine it all together, analyze, and compare. This is the best way to understand how to build your strategy and what tactics are the most effective. I don't know what about you, but I can barely think of any tool that is more accessible and efficient in data organization than Excel.
Unique items in the list
To get unique items from a range, you can use the Advanced Filter to extract the unique values from a column of data and paste them to a new location.
Creating a simple competition chart
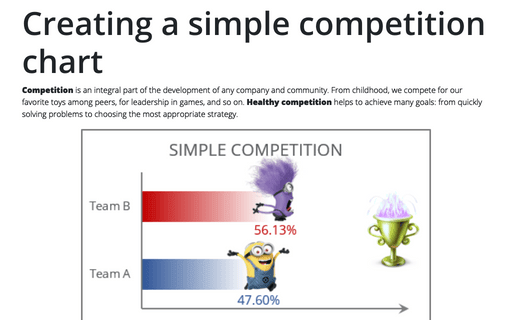
Competition is an integral part of the development of any company and community. From childhood, we compete for our favorite toys among peers, for leadership in games, and so on. Healthy competition helps to achieve many goals: from quickly solving problems to choosing the most appropriate strategy.
The compatibility mode in Excel
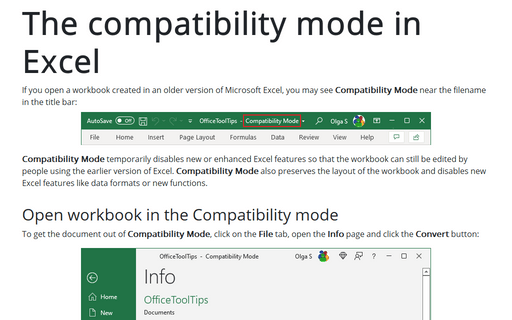
If you open a workbook created in an older version of Microsoft Excel, you may see Compatibility Mode near the filename in the title bar:
How to view historical stock prices and currency rates in Excel
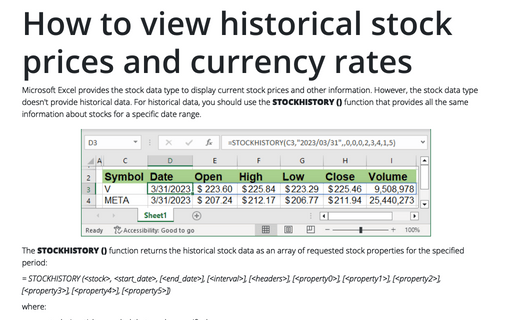
Microsoft Excel provides the stock data type to display current stock prices and other information. However, the stock data type doesn't provide historical data. For historical data, you should use the STOCKHISTORY () function that provides all the same information about stocks for a specific date range.

