How to select and format object in the slide with a big number of objects
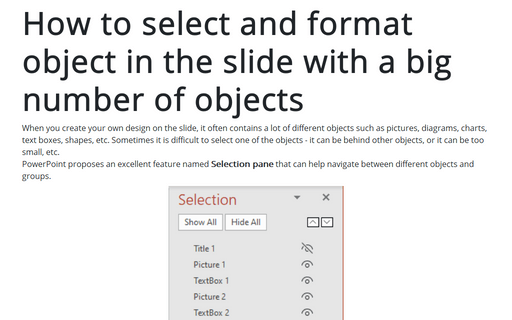
When you create your own design on the slide, it often contains a lot of different objects such as pictures, diagrams, charts, text boxes, shapes, etc. Sometimes it is difficult to select one of the objects - it can be behind other objects, or it can be too small, etc.
Add and modify shadows for Pictures, Shapes, SmartArt, Charts, and Tables in Powerpoint
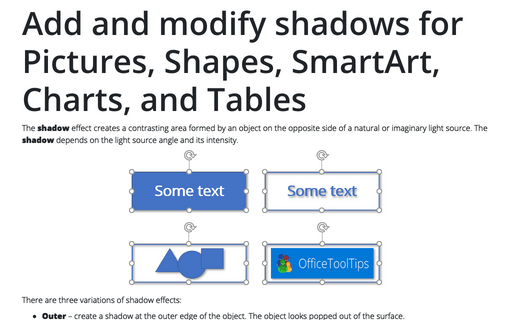
The shadow effect creates a contrasting area formed by an object on the opposite side of a natural or imaginary light source. The shadow depends on the light source angle and its intensity.
Text effects
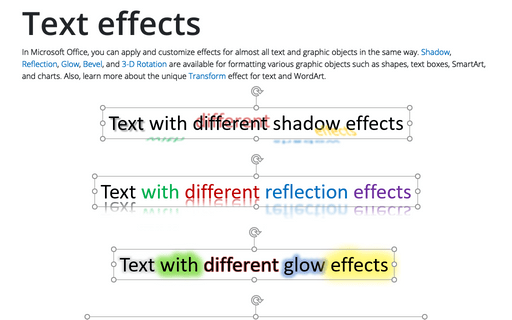
In Microsoft Office, you can apply and customize effects for almost all text and graphic objects in the same way. Shadow, Reflection, Glow, Bevel, and 3-D Rotation are available for formatting various graphic objects such as shapes, text boxes, SmartArt, and charts. Also, learn more about the unique Transform effect for text and WordArt.
Fill Settings for Shapes, Diagrams, Text Boxes and Charts in Powerpoint
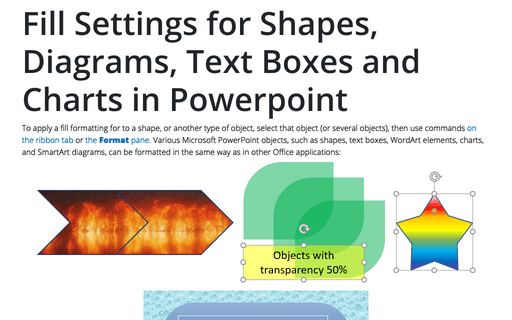
To apply a fill formatting for to a shape, or another type of object, select that object (or several objects), then use commands on the ribbon tab or the Format pane. Various Microsoft PowerPoint objects, such as shapes, text boxes, WordArt elements, charts, and SmartArt diagrams, can be formatted in the same way as in other Office applications:
Add an illusion of slide depth with reflections for Pictures, Shapes, SmartArt, Charts, and Tables
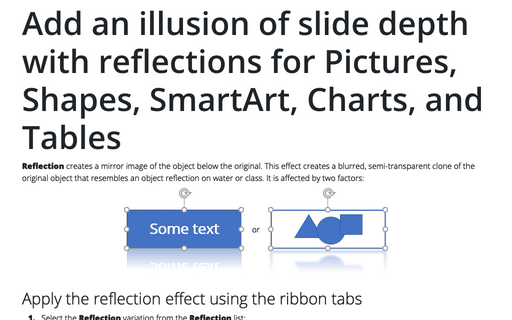
Reflection creates a mirror image of the object below the original. This effect creates a blurred, semi-transparent clone of the original object that resembles an object reflection on water or class. It is affected by two factors:
Change shape, diagram, text box and chart lines and borders in Powerpoint
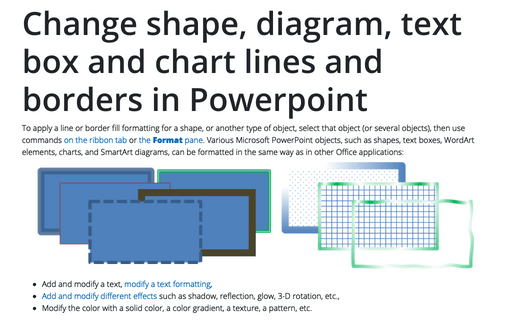
To apply a line or border fill formatting for a shape, or another type of object, select that object (or several objects), then use commands on the ribbon tab or the Format pane. Various Microsoft PowerPoint objects, such as shapes, text boxes, WordArt elements, charts, and SmartArt diagrams, can be formatted in the same way as in other Office applications:
Add 3D look to graphic objects
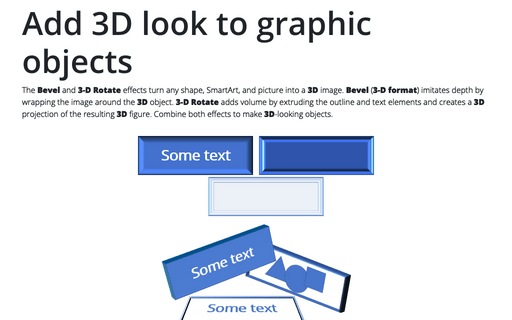
The Bevel and 3-D Rotate effects turn any shape, SmartArt, and picture into a 3D image. Bevel (3-D format) imitates depth by wrapping the image around the 3D object. 3-D Rotate adds volume by extruding the outline and text elements and creates a 3D projection of the resulting 3D figure. Combine both effects to make 3D-looking objects.
How to lock objects from moving and resizing in PowerPoint
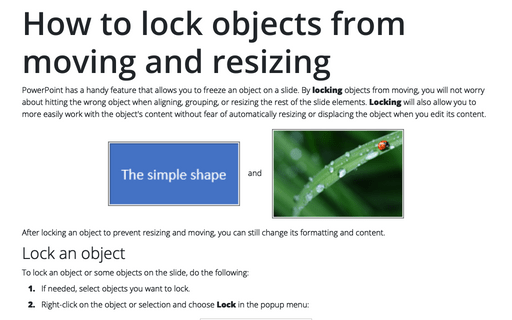
PowerPoint has a handy feature that allows you to freeze an object on a slide. By locking objects from moving, you will not worry about hitting the wrong object when aligning, grouping, or resizing the rest of the slide elements. Locking will also allow you to more easily work with the object's content without fear of automatically resizing or displacing the object when you edit its content.
How to stress cyclic processes using two arrow circle diagram
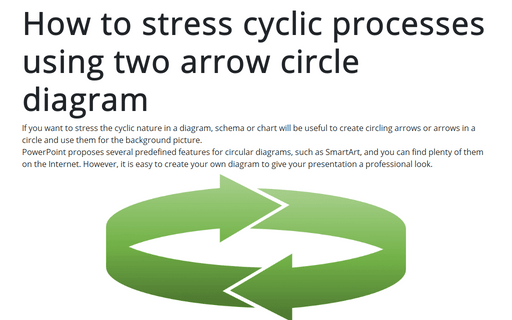
If you want to stress the cyclic nature in a diagram, schema or chart will be useful to create circling arrows or arrows in a circle and use them for the background picture.
PowerPoint proposes several predefined features for circular diagrams, such as SmartArt, and you can find plenty of them on the Internet. However, it is easy to create your own diagram to give your presentation a professional look.
PowerPoint proposes several predefined features for circular diagrams, such as SmartArt, and you can find plenty of them on the Internet. However, it is easy to create your own diagram to give your presentation a professional look.
How to create a flowchart in Word
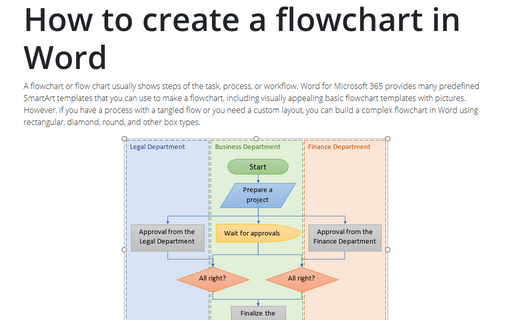
A flowchart or flow chart usually shows steps of the task, process, or workflow.
Word for Microsoft 365 provides many predefined SmartArt templates that you can use to make a flowchart,
including visually appealing basic flowchart templates with pictures. However, if you have a
process with a tangled flow or you need a custom layout, you can build a complex flowchart
in Word using rectangular, diamond, round, and other box types.
