Hide spreadsheet tabs
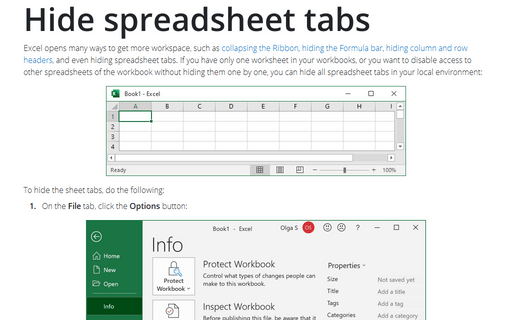
Excel opens many ways to get more workspace, such as collapsing the Ribbon, hiding the Formula bar, hiding column and row headers, and even hiding spreadsheet tabs. If you have only one worksheet in your workbooks, or you want to disable access to other spreadsheets of the workbook without hiding them one by one, you can hide all spreadsheet tabs in your local environment:
Add radiance and softness to Pictures, Shapes, SmartArt, and Charts in Powerpoint
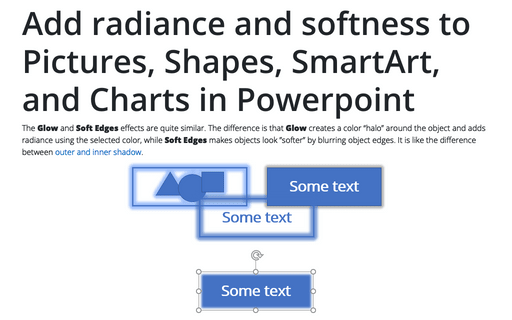
The Glow and Soft Edges effects are quite similar. The difference is that Glow creates a color “halo” around the object and adds radiance using the selected color, while Soft Edges makes objects look ”softer” by blurring object edges. It is like the difference between outer and inner shadow.
Using Solver
The Solver tool allows you to specify multiple adjustable cells and constraints on the values that the adjustable cells can have, generate a solution that maximizes or minimizes a particular worksheet cell, generate multiple solutions to a problem.
How to make a splendid circular flow chart
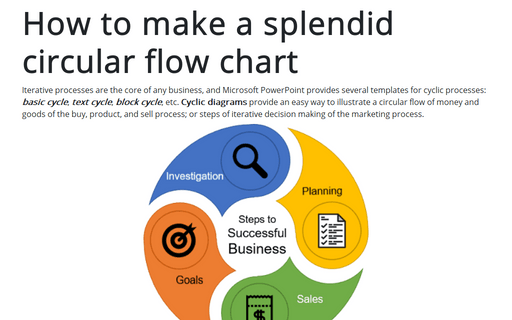
Iterative processes are the core of any business, and Microsoft PowerPoint provides several
templates for cyclic processes: basic cycle, text cycle,
block cycle, etc. Cyclic diagrams provide an easy way to illustrate a
circular flow of money and goods of the buy, product, and sell process; or steps of iterative
decision making of the marketing process.
How to create an organizational chart with two or more connection lines
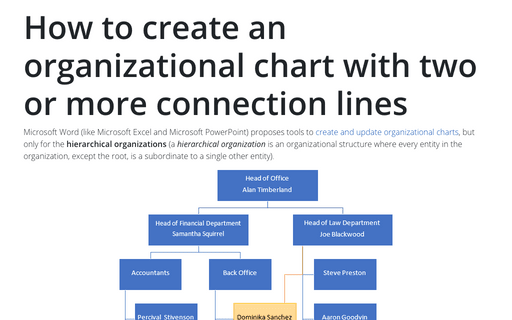
Microsoft Word (like Microsoft Excel and Microsoft PowerPoint) proposes tools to
create and update organizational charts,
but only for the hierarchical organizations. A hierarchical organization is
a tree-like organizational structure where every entity in the organization, except the root, is
subordinate to a single other node, i.e., has only one parent.
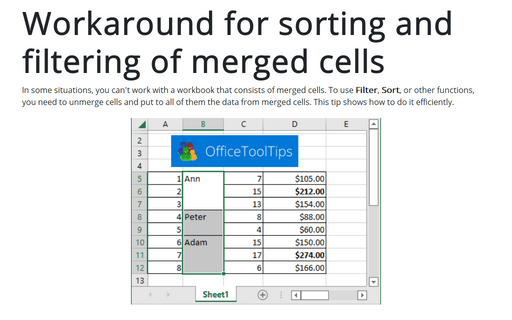
Workaround for sorting and filtering of merged cells
In some situations, you can't work with a workbook that consists of merged cells. To use Filter, Sort, or other functions, you need to unmerge cells and put to all of them the data from merged cells. This tip shows how to do it efficiently.
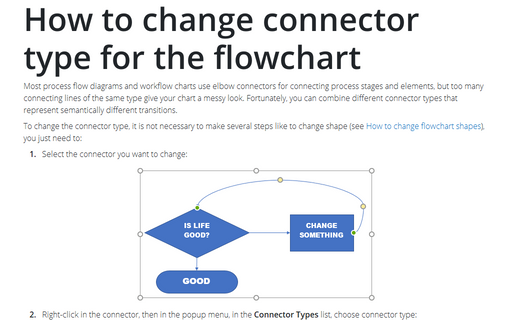
How to change connector type for the flowchart
Most process flow diagrams and workflow charts use elbow connectors for connecting process stages and
elements, but too many connecting lines of the same type give your chart a messy look. Fortunately, you can
combine different connector types that represent semantically different transitions.
Modify cell data
To enter a value in the cell, activate it by selecting with the mouse or moving the cursor into the cell using the navigation keys, enter the value or type the text, and press the Enter key or one of the navigation arrow keys. See how to change the direction of the cursor after pressing the Enter key.
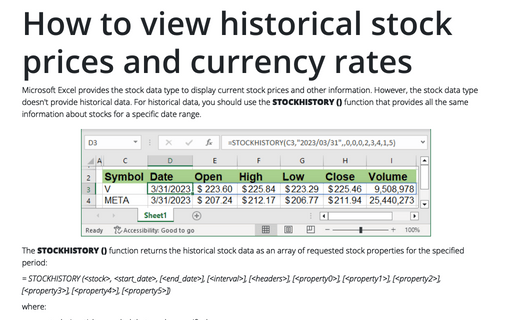
How to view historical stock prices and currency rates in Excel
Microsoft Excel provides the stock data type to display current stock prices and other information. However, the stock data type doesn't provide historical data. For historical data, you should use the STOCKHISTORY () function that provides all the same information about stocks for a specific date range.
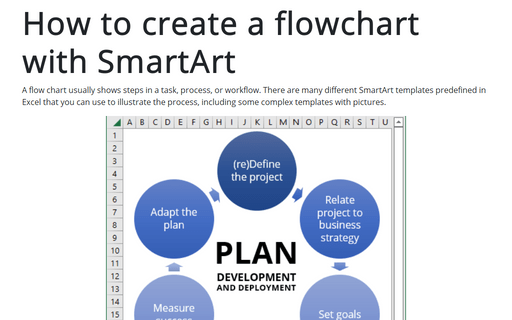
How to create a flowchart with SmartArt
A flow chart usually shows steps in a task, process, or workflow. There are many different SmartArt templates predefined in Excel that you can use to illustrate the process, including some complex templates with pictures.
