How to customize your local Excel chart settings
Excel
365
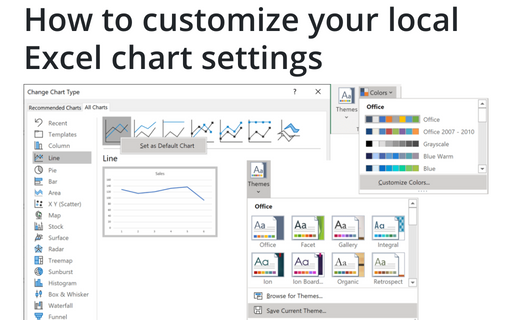
The default installation of Excel has reasonable presets for chart types and colors, but you can change those
defaults according to your own preferences.
1. Change the default chart
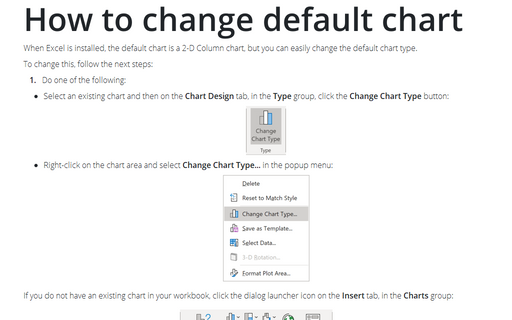
The default chart after installation of Excel is a 2-D Column chart, but you can easily change the default chart type.

See How to change default chart for more details.
2. Change the default colors that Excel uses for chart series

See How to change the default colors that Excel uses for chart series for more details.
See also this tip in French: Comment personnaliser les paramètres locaux de graphique Excel.

