Settings in Excel 365
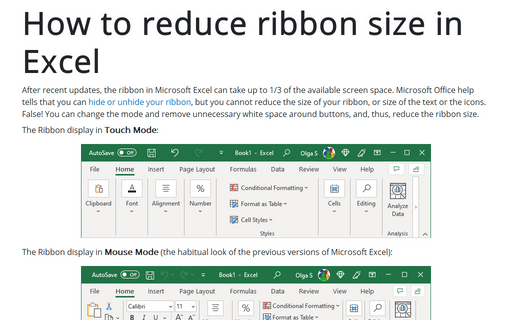
How to reduce ribbon size in Excel
After recent updates, the ribbon in Microsoft Excel can take up to 1/3 of the available screen space. Microsoft Office help tells that you can hide or unhide your ribbon, but you cannot reduce the size of your ribbon or the size of the text or the icons. False! You can change the mode, remove unnecessary white space around buttons and, thus, reduce the ribbon size.
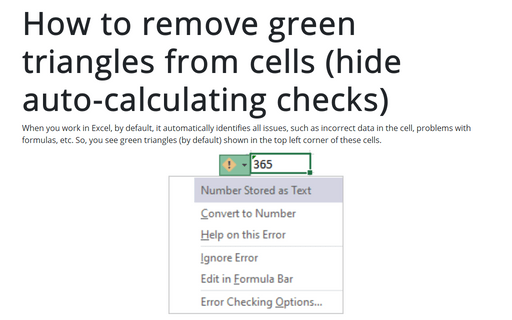
How to remove green triangles from cells (hide auto-calculating checks)
By default, when you work in Excel, it automatically identifies all issues, such as incorrect data in the cell, problems with formulas, etc. So, you see green triangles (by default) shown in the top left corner of these cells.
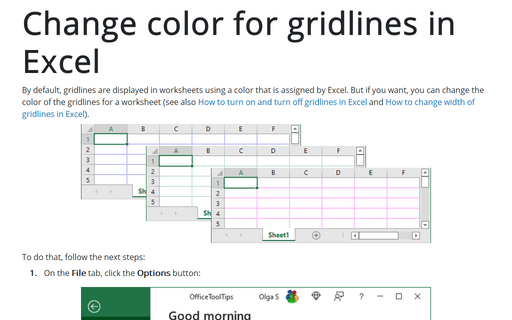
Change color for gridlines in Excel
By default, gridlines are displayed in worksheets using a color assigned by Excel. But if you want, you can change the color of the gridlines for a worksheet (see also How to turn on and turn off gridlines in Excel and How to change width of gridlines in Excel).
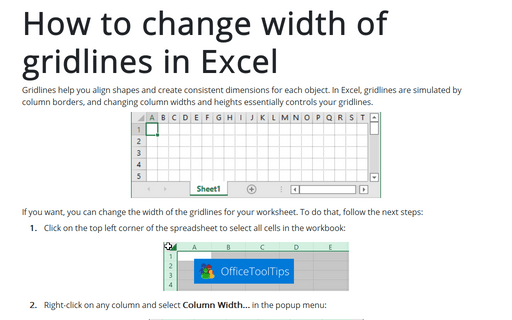
How to change width of gridlines in Excel
Gridlines help you align shapes and create consistent dimensions for each object. In Excel, gridlines are simulated by column borders, and changing column widths and heights essentially controls your gridlines.
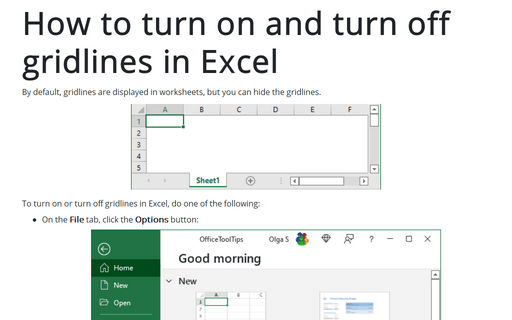
How to turn on and turn off gridlines in Excel
By default, gridlines are displayed in worksheets, but you can hide the gridlines.
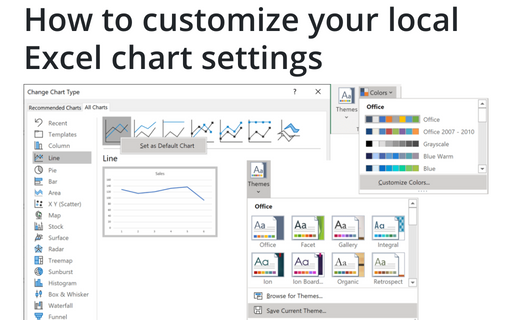
How to customize your local Excel chart settings
The default installation of Excel has reasonable presets for chart types and colors, but you can change those
defaults according to your own preferences.
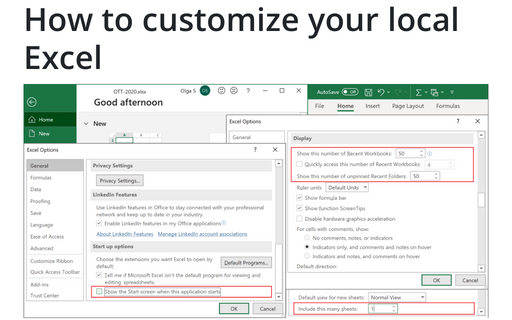
How to customize your local Excel
Excel is heavily used by all Microsoft Office users, and automatically opened workbooks, customizations of the menu, recent documents, and start screen allow you to save a lot of time.
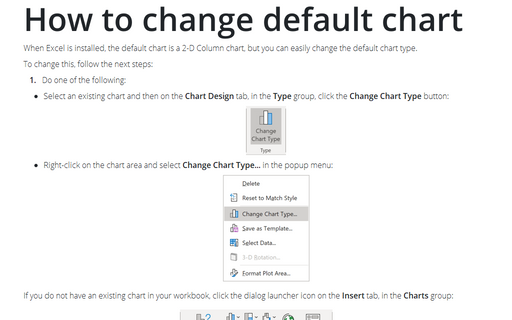
How to change default chart
When Excel is installed, the default chart is a 2-D Column chart, but you can easily change the default chart type.
How to change the default colors that Excel uses for chart series
Every workbook uses a palette of 56 colors, but you can change the palette for the current workbook or even change the default colors for new workbooks.
How to manage Add-ins
Some function in Excel is available only when the add-in is installed. For example, Solver or the Analysis group is not available in standard ribbons; you need to install the add-in before you can use it. See also Using Solver.
