Side by side comparison bar chart
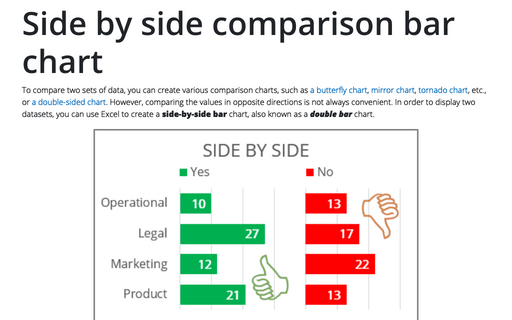
To compare two sets of data, you can create various comparison charts, such as a butterfly chart, mirror chart, tornado chart, etc., or a double-sided chart. However, comparing the values in opposite directions is not always convenient. In order to display two datasets, you can use Excel to create a side-by-side bar chart, also known as a double bar chart.
Creating a twin or double thermometer chart
The thermometer chart (also known as a thermometer goal chart or progress chart) displays the percentage of a completed task. See also how to create a simple and glossy thermometer chart. But sometimes, displaying two results in one chart will be more informative and impressive. Below is an example of creating a thermometer chart with two competitive columns:
How to format negative timestamps
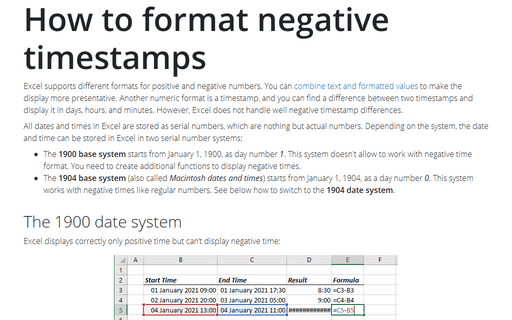
Excel supports different formats for positive and negative numbers. You can combine text and formatted values to make the display more presentative. Another numeric format is a timestamp, and you can find a difference between two timestamps and display it in days, hours, and minutes. However, Excel does not handle well negative timestamp differences.
Excel Formula auditing tools
When working with formulas in Excel, it is often necessary to find where a mistake was made. Excel provides very useful tools:
- the simple way to evaluate just a part of a formula,
- the Formula Evaluator allows you to see how the various parts of a nested formula are evaluated and the order in which the formula is evaluated:
Find and replace in Excel
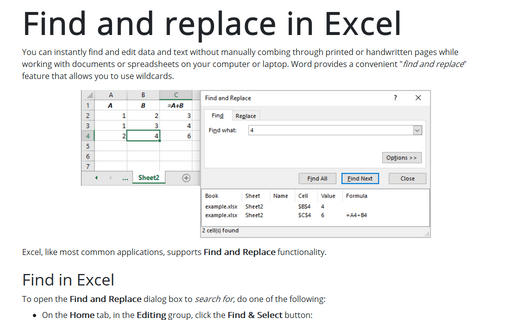
You can instantly find and edit data and text without manually combing through printed or handwritten pages while working with documents or spreadsheets on your computer or laptop. Word provides a convenient "find and replace" feature that allows you to use wildcards.
Quick way to transform your data without using formulas
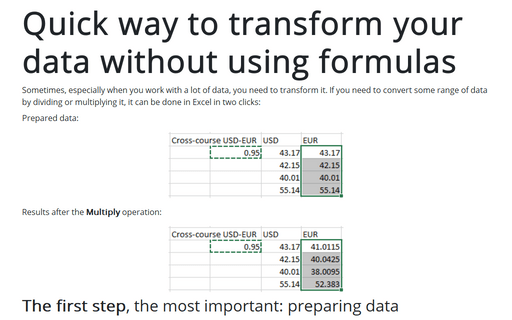
Sometimes, especially when you work with a lot of data, you need to transform it. If you need to convert some range of data by dividing or multiplying it, it can be done in Excel in two clicks:
Show chart data in hidden cells
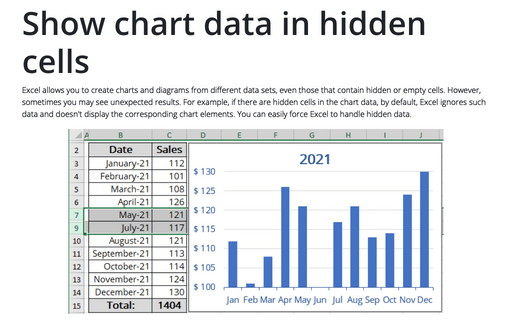
Excel allows you to create charts and diagrams from different data sets, even those that contain hidden or empty cells. However, sometimes you may see unexpected results. For example, if there are hidden cells in the chart data, by default, Excel ignores such data and doesn't display the corresponding chart elements. You can easily force Excel to handle hidden data.
Check invalid data
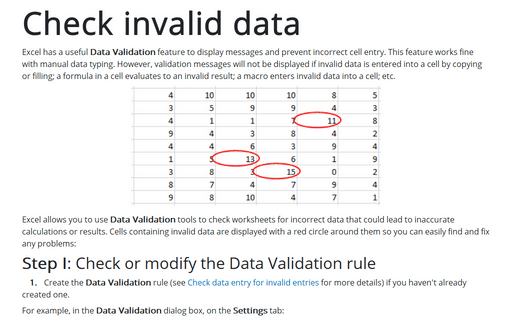
Excel has a useful Data Validation feature to display messages and prevent incorrect cell entry. This feature works fine with manual data typing. However, validation messages will not be displayed if invalid data is entered into a cell by copying or filling; a formula in a cell evaluates to an invalid result; a macro enters invalid data into a cell; etc.
How to create dependent on a volume chart title
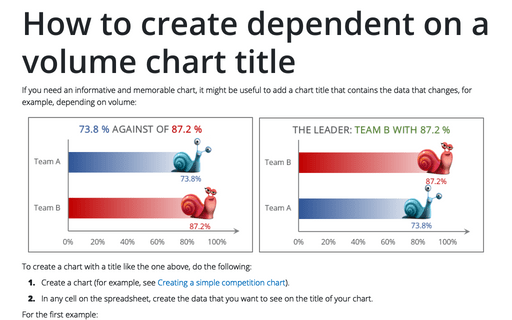
If you need an informative and memorable chart, it might be useful to add a chart title that contains the data that changes, for example, depending on volume:
How many weeks left to or passed from the specific date in Excel
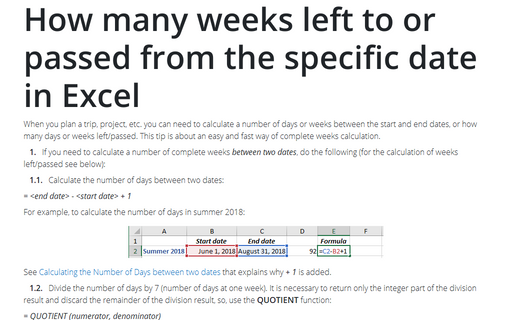
When you plan a trip, project, etc. you can need to calculate a number of days or weeks between the start and end dates, or how many days or weeks left/passed. This tip is about an easy and fast way of complete weeks calculation.
