Add 3D look to graphic objects
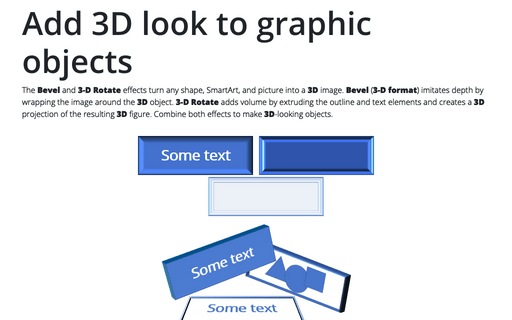
The Bevel and 3-D Rotate effects turn any shape, SmartArt, and picture into a 3D image. Bevel (3-D format) imitates depth by wrapping the image around the 3D object. 3-D Rotate adds volume by extruding the outline and text elements and creates a 3D projection of the resulting 3D figure. Combine both effects to make 3D-looking objects.
How to create a Jigsaw puzzle chart
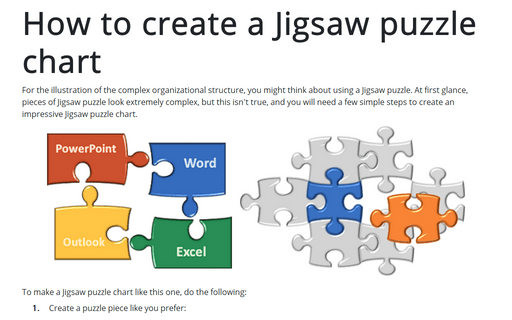
To illustrate the complex organizational structure, you might think about using a Jigsaw puzzle. At first glance, pieces of the Jigsaw puzzle look extremely complex, but this isn't true, and you will need a few simple steps to create an impressive Jigsaw puzzle chart.
Change shape, diagram, text box and chart lines and borders in Powerpoint
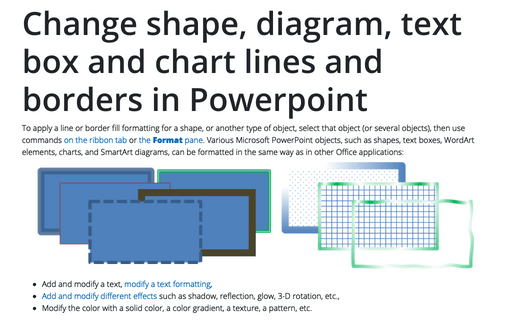
To apply a line or border fill formatting for a shape, or another type of object, select that object (or several objects), then use commands on the ribbon tab or the Format pane. Various Microsoft PowerPoint objects, such as shapes, text boxes, WordArt elements, charts, and SmartArt diagrams, can be formatted in the same way as in other Office applications:
Add and modify shadows for Pictures, Shapes, SmartArt, Charts, and Tables in Powerpoint
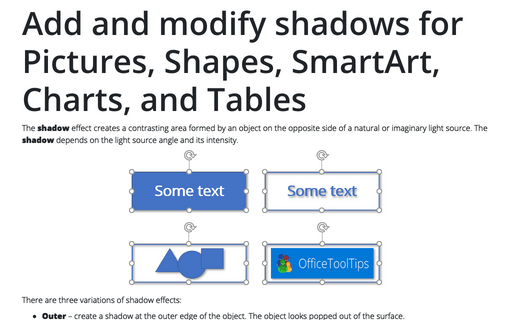
The shadow effect creates a contrasting area formed by an object on the opposite side of a natural or imaginary light source. The shadow depends on the light source angle and its intensity.
Fill Settings for Shapes, Diagrams, Text Boxes and Charts in Powerpoint
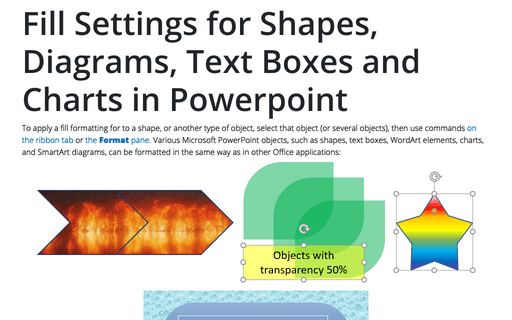
To apply a fill formatting for to a shape, or another type of object, select that object (or several objects), then use commands on the ribbon tab or the Format pane. Various Microsoft PowerPoint objects, such as shapes, text boxes, WordArt elements, charts, and SmartArt diagrams, can be formatted in the same way as in other Office applications:
How to insert cell content to the shape
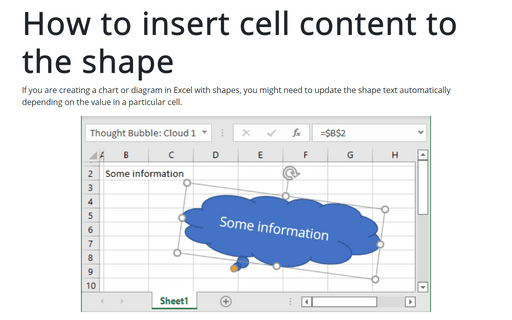
If you create a chart or diagram in Excel with shapes, you might need to update the shape text automatically depending on the value in a particular cell.
Viewing a worksheet in multiple windows
When working with multiple tables and large amounts of data, when designing or analyzing charts or diagrams, you may need to view two or more parts of the worksheet simultaneously.
How to update or change links to Excel charts or spreadsheet data in PowerPoint
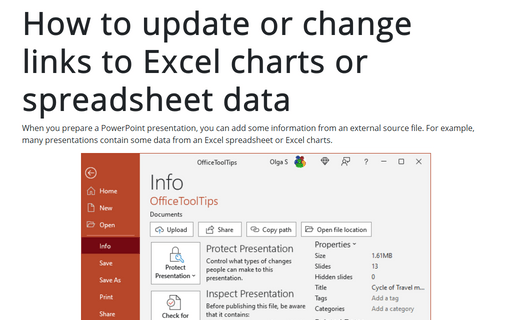
When you prepare a PowerPoint presentation, you can add some information from an external source file. For example, many presentations contain some data from an Excel spreadsheet or Excel charts.
How to create an equilateral triangle, a regular square, and other regular polygons in Excel
For some charts or diagrams, you need to create a regular polygon – equiangular
(all angles are equal) or equilateral (all sides have the same length).
E.g., equilateral triangle, regular square, etc.
How to create an equilateral triangle, a regular square, and other regular polygons in PowerPoint
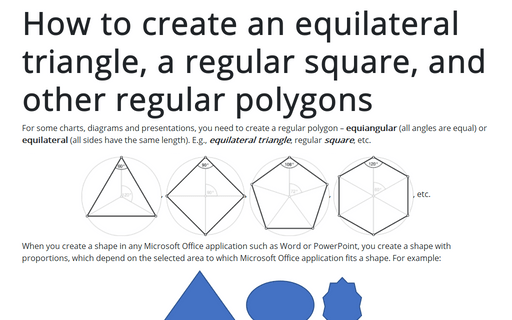
For some charts or diagrams, you need to create a regular polygon – equiangular
(all angles are equal) or equilateral (all sides have the same length).
E.g., equilateral triangle, regular square, etc.
