How to evaluate startup or new business plans
1. Compare the Break-even points
Let's simplify the problem and assume that you have three different businessmen who want to open a new art cafe for freelancers and entrepreneurs:

To start a new business, entrepreneurs need a startup loan to cover:
- amount of $8,000 to purchase the necessary equipment,
- amount to cover fixed costs for 1 year:

The main thing in making a decision is how quickly the team can earn an amount sufficient to return the full loan amount. To calculate the return period, you need to calculate the break-even point. The break-even point (or breakeven point, BEP) is the volume of production and sales of products at which income offsets the fixed costs, and with the production and sale of each subsequent unit of production, the company begins to make a profit:


So, to return the startup loans:
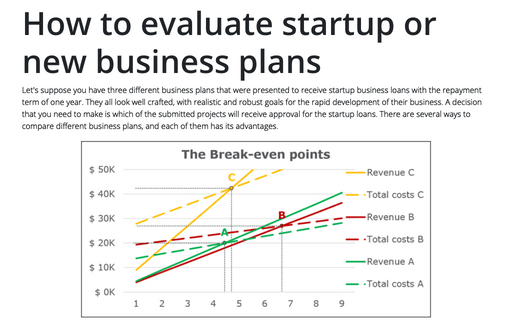
- Team A should sell 6,667 units and receive $20,000 in revenue,
- Team B should sell 6,000 units and receive $27,000 in revenue,
- Team C should sell 14,118 units and receive $42,353 in revenue.
The Break-even points of three teams look like:

See How to create a break-even chart in Excel for more details. This chart has one difference: to compare three break-even points, they need to resize on the timeline. So, the horizontal axis shows months. To build a chart using this axis, you need to calculate the number of units to sell per month instead of 1,000 units.
Team A and Team B can sell the necessary number of units during the first 5 months. Team B can sell enough units during the 7 months. Usually, the shorter period is better unless you find the sales volume unrealistic.
2. The opportunity zones
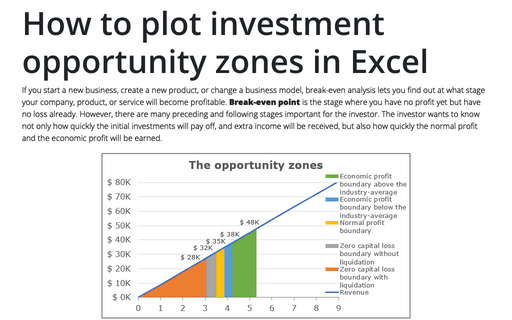
The lender must be sure of the early repayment of the loan. Thus, the main part of the loan amount that must be repaid for a maximum period of one year, consisting of the total fixed costs for 1 year plus half of the amount borrowed to purchase the necessary equipment (the lender is confident that the equipment worth at least half of its initial value in the worst-case):
- Zero capital loss boundary with liquidation is a minimum total revenue that the business needs to generate in the pessimistic scenario of the business liquidation. It consists of the total variable costs for 1 year plus half of the amount invested in the purchase of the necessary equipment (in this case, the investor is confident that the equipment is worth at least half of its cost in a worst-case scenario):

- Zero capital loss boundary without liquidation is equal to the initial invested amount:

- Normal profit boundary is a total amount that can be received from an alternative investment (e.g., index funds, bonds, etc.). For this example, the return of investment of an alternative opportunity is 10%.
- Economic profit boundary below the industry-average is an expected total revenue for a similar business. For this example, the percentage of an industry-average economic profit is 20%.
- Economic profit boundary above the industry-average is an expected total revenue that the investor expects from the competitive advantages of this particular business. For this example, the percentage is 50%.

See How to plot investment opportunity zones in Excel for more detail.
3. Control of the investment project
After making a decision, which of the proposed projects can be chosen for the investment project, the main point is how to control the plan of investment returns. There are a lot of different reports and graphs that can be used for this purpose. One of the useful graphs is a bullet chart:

This chart shows all the calculated zones of investment returns, the goal of 20% of the successful project, and the actual value.
See how to create a bullet chart in Excel for more detail.

