Creating automatically extended plot ranges
If you often need to adjust your data ranges so that your charts plot an updated data range, you may be interested in a trick that forces Excel to update the chart's data range whenever you add new data to your spreadsheet.
What Excel Skills are Useful to Include in a Resume?
Microsoft Excel is an integral part of today's business environment and many professional fields. This software product has become the most popular tool for data processing, analysis, and data visualization. Every day, millions of professionals around the world use Excel to solve problems of varying complexity. Excel skills often play a key role in hiring decisions. So, they can be your competitive advantage.
Logarithmic trend equation and forecast
If the growth or decay of the data first rapidly accelerates and then slows down over time, the best type of trend line is logarithmic. See more about the different types of trendlines you can create in Excel:
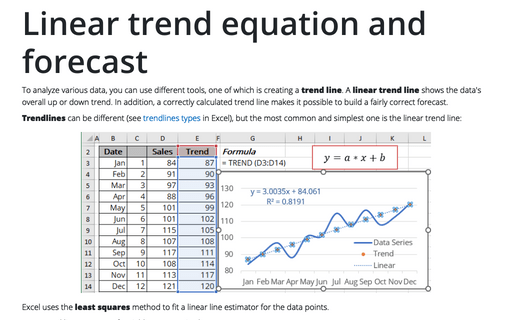
Linear trend equation and forecast
To analyze various data, you can use different tools, one of which is creating a trend line. A linear trend line shows the data's overall up or down trend. In addition, a correctly calculated trend line makes it possible to build a fairly correct forecast.
Planning and IT Project Estimation in Excel: All You Need To Know
You are about to travel into the center of IT project management, where chaos can be controlled, deadlines can be met, and budgets can be respected. How? through Excel's enchanted universe. Yes, the same tool that you might use to make budgets, manage data, or even just keep tabs on your spending.


