Creating a twin or double thermometer chart
The thermometer chart (also known as a thermometer goal chart or progress chart) displays the percentage of a completed task. See also how to create a simple and glossy thermometer chart. But sometimes, displaying two results in one chart will be more informative and impressive. Below is an example of creating a thermometer chart with two competitive columns:
How to hide, display, and expand the Formula bar
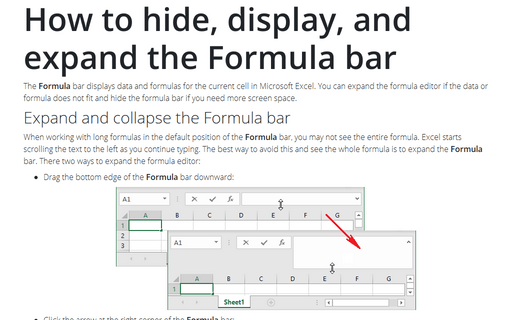
The Formula bar displays data and formulas for the current cell in Microsoft Excel. You can expand the formula editor if the data or formula does not fit and hide the formula bar if you need more screen space.
Using the formula bar as a calculator
If you simply need to perform a calculation, you can use the Formula bar as a calculator.
Hide formulas from appearing in the edit bar
You can usually view formulas in an Excel cell when the cell is selected, but you can protect a spreadsheet by hiding the formulas in some cells.
Read and Unread email messages
New messages that have been received appear in your Outlook mailbox as Unread emails, with a bold blue header and a blue indicator vertical bar on the left. After you open the message, Outlook automatically marks it as Read, changes the bold blue highlight to regular, and hides the blue unread indicator bar:
The compatibility mode in Excel
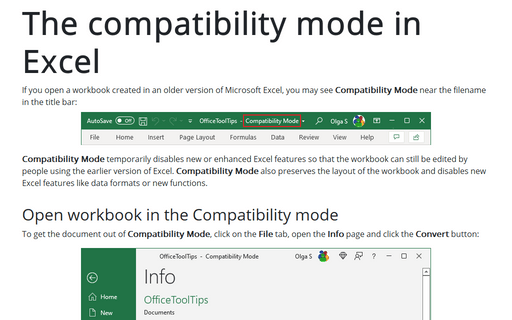
If you open a workbook created in an older version of Microsoft Excel, you may see Compatibility Mode near the filename in the title bar:
How to insert a Boolean algebra equation
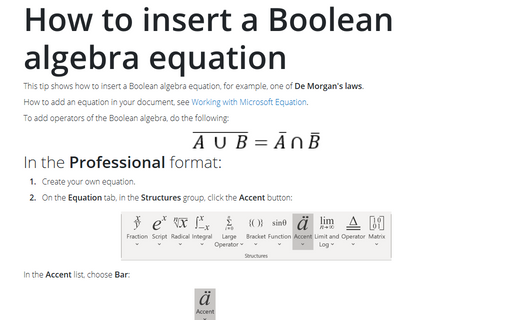
This tip shows how to insert a Boolean algebra equation, for example, one of De Morgan's laws.
Trendlines and Moving Average in Excel
A trend line (or trendline, also known as a line of best fit) is a straight or curved line on a chart that shows a general pattern or the general direction of the data. The trend line displays the approximated values obtained using some mathematical function. The choice of function for constructing a trend line is usually determined by the nature of the data.
Insert a vertical bar with integration limits into the equation
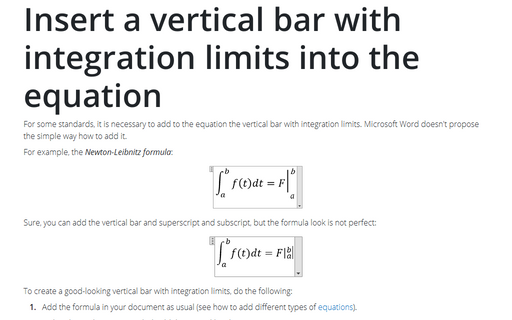
For some standards, it is necessary to add to the equation the vertical bar with integration limits.
Microsoft Word doesn't propose the simple way how to add it.
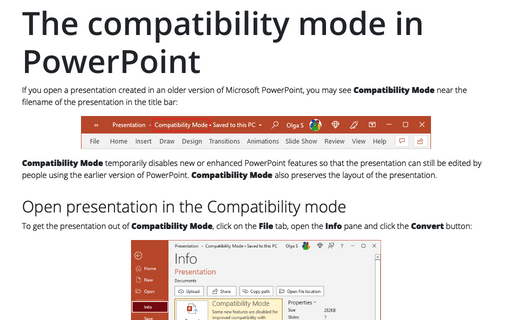
The compatibility mode in PowerPoint
If you open a presentation created in an older version of Microsoft PowerPoint, you may see Compatibility Mode near the filename of the presentation in the title bar:

