Graphics in Word 2007
Cropping a picture to a shape
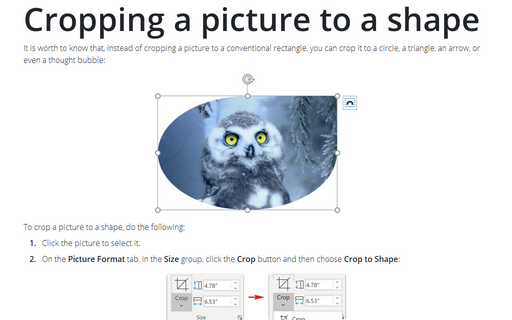
It is worth to know that, instead of cropping a picture to a conventional rectangle, you can crop it to a
circle, a triangle, an arrow, or even a thought bubble:
Modifying an Organizational Chart
How to create an organizational chart in Microsoft Word 2007 see Using the Organizational Chart Tool.
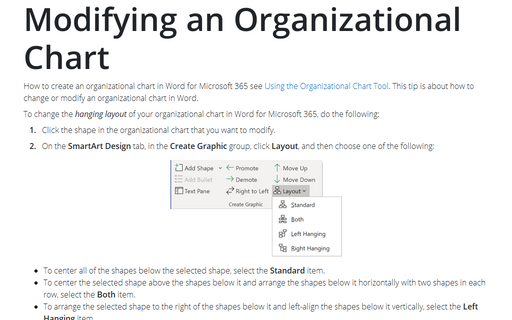
This tip is about how to change or modify an organizational chart in Word.
Adding shapes into an Organizational Chart
How to create an organizational chart in Microsoft Word 2007 see Using the Organizational Chart Tool.
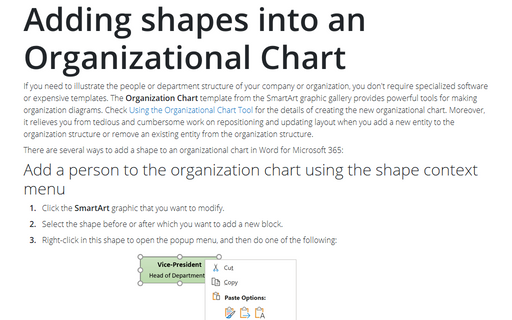
This tip is how to add a new shape an organizational chart in Word.
Hiding pictures
Including a large number of in-line pictures in your documents slows down Word's performance. You can
improve performance by replacing actual pictures with picture placeholders.
Using the Organizational Chart Tool
In most cases, it is recommended to use Visio to create diagrams, but in some simple cases, such as company
organizational charts, you can successfully use the built-in Word tools.
Adding captions with AutoCaption
Use the AutoCaption feature if you want to add captions to all items of a particular type
automatically.
How to replace text with a graphic or an object
Although the Find And Replace dialog box doesn't directly support replacing text with graphics or
objects, you can easily perform this action using the Clipboard and the ^c wildcard.
How to create a flowchart in Word
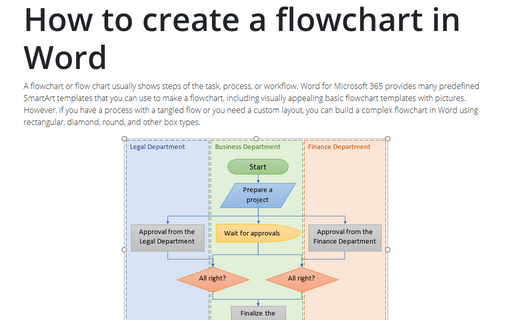
If you need to draw a diagram, such as a flowchart, in the most of cases you need neither Visio, nor
PowerPoint, use Word to draw with AutoShapes.
Snap an object to the Grid or to a Shape
By default, Word makes objects snap (jump) to an underlying grid laid across the document. If you drag an
object, such as a shape, you'll notice that it moves in little jerks rather than smoothly. This is because
of the grid - but because the grid is normally invisible, it's not obvious.
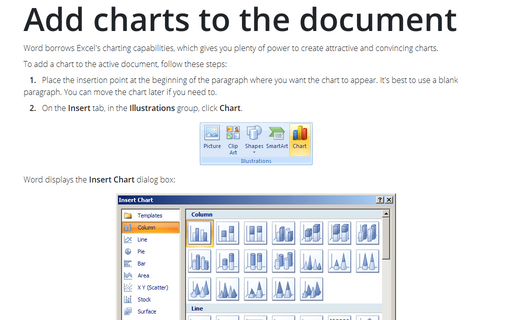
Add charts to the document
Word borrows Excel's charting capabilities, which gives you plenty of power to create attractive and
convincing charts.
