How to create bar chart of the survey results
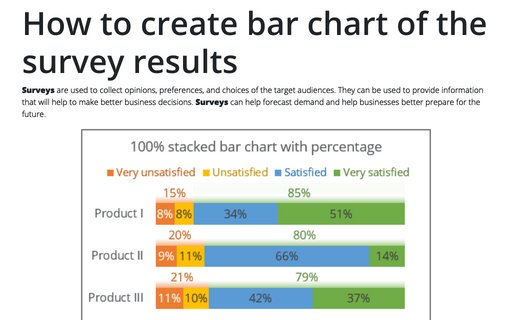
Surveys are used to collect opinions, preferences, and choices of the target audiences. They can be used to provide information that will help to make better business decisions. Surveys can help forecast demand and help businesses better prepare for the future.
How to show Likert scale chart (integrated neutral)
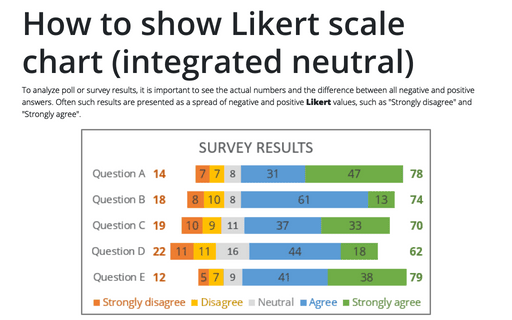
To analyze poll or survey results, it is important to see the actual numbers and the difference between all negative and positive answers. Often such results are presented as a spread of negative and positive Likert values, such as "Strongly disagree" and "Strongly agree".
How to create simple diverging bar chart
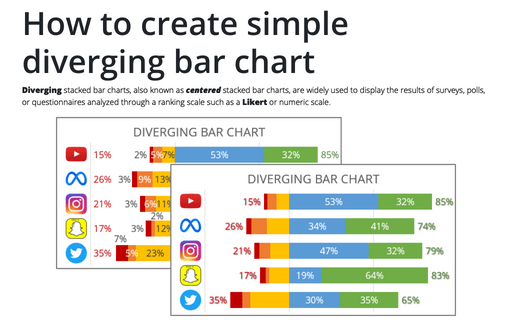
Diverging stacked bar charts, also known as centered stacked bar charts, are widely used to display the results of surveys, polls, or questionnaires analyzed through a ranking scale such as a Likert or numeric scale.
How to show Likert scale chart with extra neutral
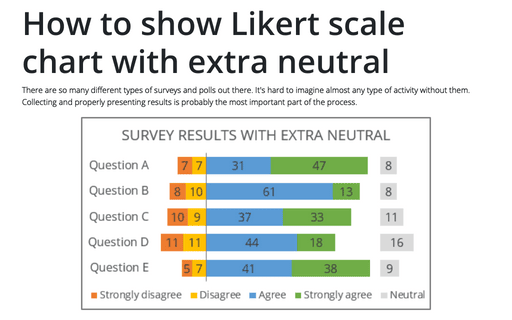
There are so many different types of surveys and polls out there. It's hard to imagine almost any type of activity without them. Collecting and properly presenting results is probably the most important part of the process.
How to create one chat of split bars or small multiple bars in Excel
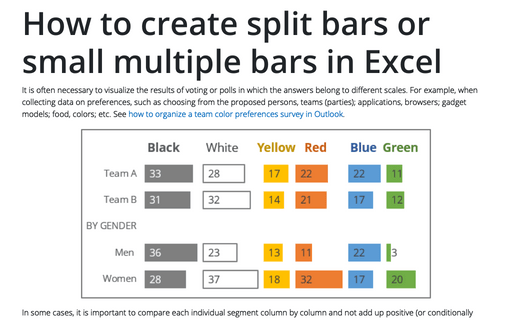
It is often necessary to visualize the results of voting or polls in which the answers belong to different scales. For example, when collecting data on preferences, such as choosing from the proposed persons, teams (parties); applications, browsers; gadget models; food, colors; etc. See how to organize a team color preferences survey in Outlook.
Protecting workbook elements
Protecting a workbook is different from protecting the Excel file with a password to prevent reading/writing or locking the spreadsheet elements to prevent editing. Workbook protection forbids other users to add, move, rename or delete worksheets and defends against viewing hidden worksheets or hiding worksheets.
Paste results into cell without formulas
You may not always want to copy everything from the source cells to the destination cells. For example, you may want to copy only the current values of formulas rather than the formulas themselves.
Goal Seeking
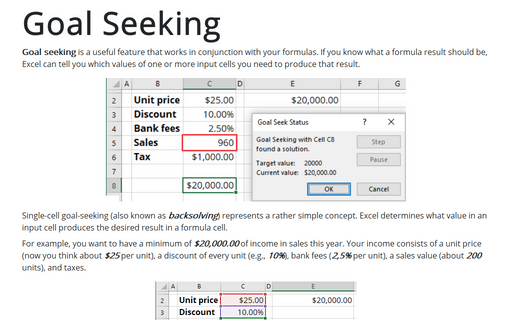
Goal seeking is a useful feature that works in conjunction with your formulas. If you know what a formula result should be, Excel can tell you which values of one or more input cells you need to produce that result.
Applying Conditional Formatting
This tip describes how to use conditional formatting for comfortable viewing results in the worksheet.
How to highlight a data point
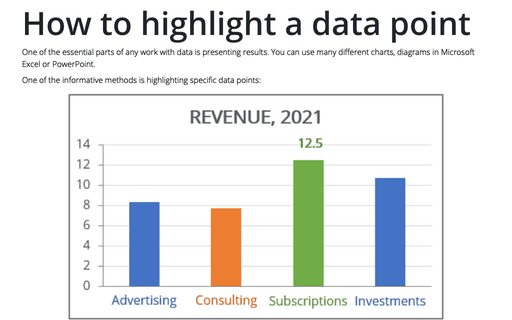
One of the essential parts of any work with data is presenting results. You can use many different
charts, diagrams in Microsoft Excel or PowerPoint.
