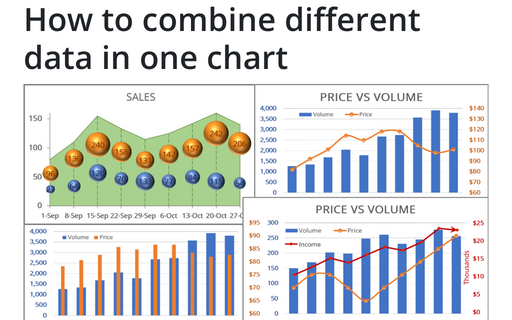
How to combine different data in one chart
To make your data more information, you can combine different chars in many ways.
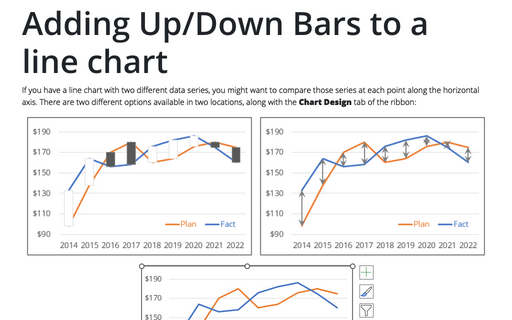
Adding Up/Down Bars to a line chart
If you have a line chart with two different data series, you might want to compare those series at each point along the horizontal axis. There are two different options available in two locations, along with the Chart Design tab of the ribbon:
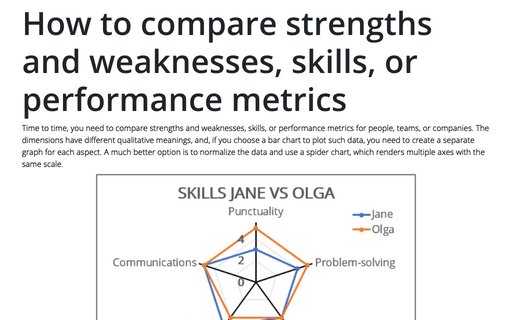
How to compare strengths and weaknesses, skills, or performance metrics
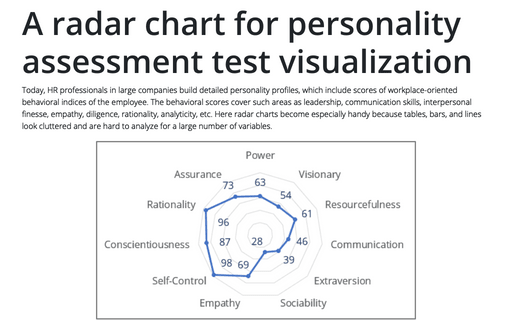
Time to time, you need to compare strengths and weaknesses, skills, or performance metrics for people, teams, or companies. The dimensions have different qualitative meanings, and, if you choose a bar chart to plot such data, you need to create a separate graph for each aspect.
A quick way to duplicate all of the custom chart formatting
The creation of a large number of visually consistent charts to represent different data is a time consuming and error prone task unless you know how to copy formatting between charts.
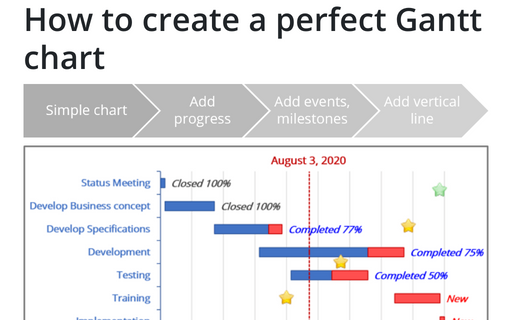
How to create a perfect Gantt chart
Gantt charts illustrate project schedules and, thus, often used by project managers. Project management tools like Microsoft Project are better suited for Gantt charts, but it is easy to create a Gantt chart in Excel following the simple steps.
A radar chart for personality assessment test visualization
Today, HR professionals in large companies build detailed personality profiles, which include scores of workplace-oriented behavioral indices of the employee. The behavioral scores cover such areas as leadership, communication skills, interpersonal finesse, empathy, diligence, rationality, analyticity, etc.
How to create a combination chart in PowerPoint
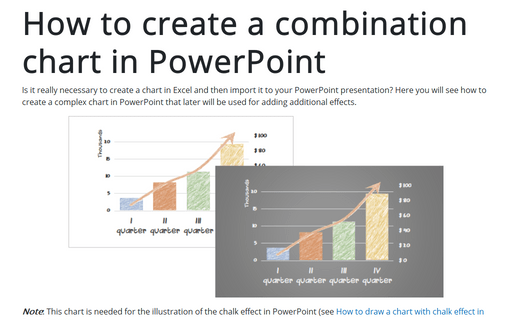
Is it really necessary to create a chart in Excel and then import it to your PowerPoint presentation? Here you will see how to create a complex chart in PowerPoint that later will be used for adding additional effects.
Competition chart with residual data
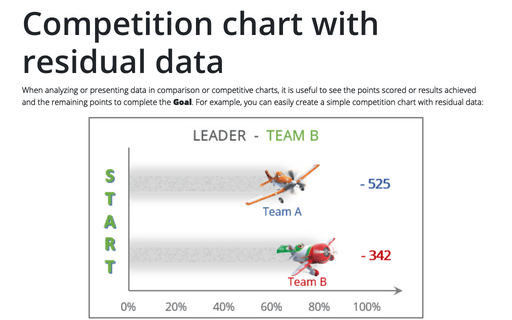
When analyzing or presenting data in comparison or competitive charts, it is useful to see the points scored or results achieved and the remaining points to complete the Goal. For example, you can easily create a simple competition chart with residual data:
How to customize your local Excel chart settings
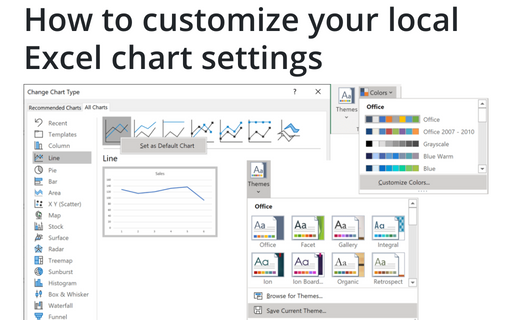
The default installation of Excel has reasonable presets for chart types and colors, but you can change those
defaults according to your own preferences.
Creating a simple thermometer chart
A thermometer chart (also known as a thermometer goal chart or progress chart) is a kind of progress chart that shows the current completed percentage of the task or the value of any metric relative to the predefined value. E.g., the thermometer scale can display the sales plan status or client satisfaction rate.
