How to create a cycle flow chart using four arrows in a circle
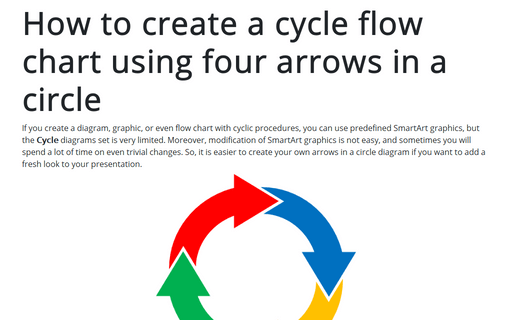
If you create a diagram, graphic, or even flow chart with cyclic procedures, you can use predefined SmartArt graphics, but the Cycle diagrams set is very limited. Moreover, modification of SmartArt graphics is not easy, and sometimes you will spend a lot of time on even trivial changes. So, it is easier to create your own arrows in a circle diagram if you want to add a fresh look to your presentation.
Creating and using named ranges
Named ranges (also known as defined ranges) are a powerful feature in Excel that allows you to assign a symbolic name to a cell, range of cells, or formula. These defined names are a convenient replacement for the address of a cell, data range, or formula in other formulas, charts, diagrams, shapes, etc.
Select special types of cells
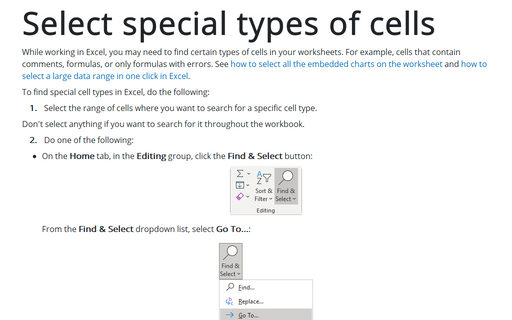
While working in Excel, you may need to find certain types of cells in your worksheets. For example, cells that contain comments, formulas, or only formulas with errors. See how to select all the embedded charts on the worksheet and how to select a large data range in one click in Excel.
How to format negative timestamps
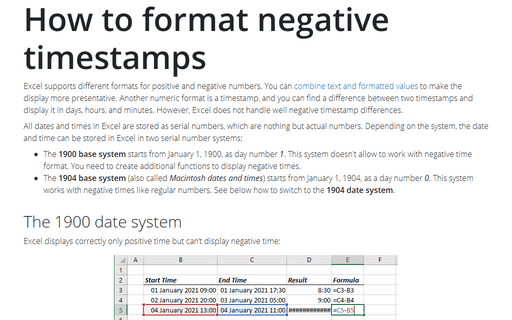
Excel supports different formats for positive and negative numbers. You can combine text and formatted values to make the display more presentative. Another numeric format is a timestamp, and you can find a difference between two timestamps and display it in days, hours, and minutes. However, Excel does not handle well negative timestamp differences.
How to work with a large number of objects in Excel
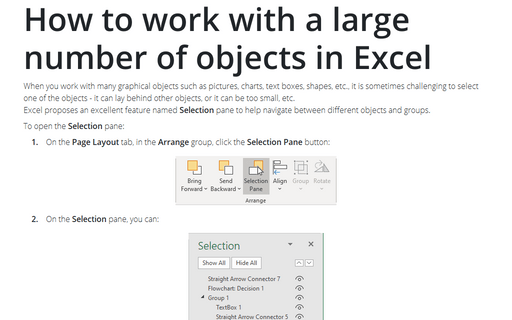
When you work with many graphical objects such as pictures, charts, text boxes, shapes, etc., it is sometimes challenging to select one of the objects - it can lay behind other objects, or it can be too small, etc.
Excel proposes an excellent feature named Selection pane to help navigate between different objects and groups.
Excel proposes an excellent feature named Selection pane to help navigate between different objects and groups.
How to turn on or turn off automatic generation of Alternative text for pictures
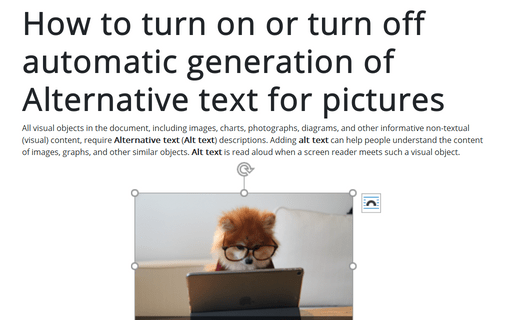
All visual objects in the document, including images, charts, photographs, diagrams, and other informative non-textual (visual) content, require Alternative text (Alt text) descriptions. Adding alt text can help people understand the content of images, graphs, and other similar objects. Alt text is read aloud when a screen reader meets such a visual object.
How to work with a large number of objects in Word
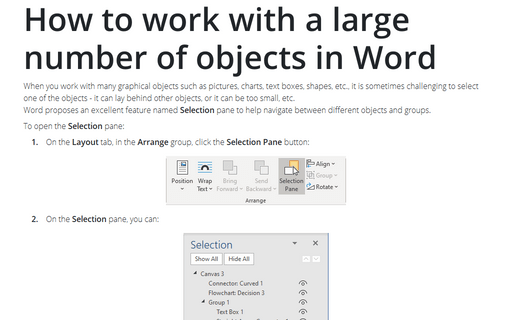
When you work with many graphical objects such as pictures, charts, text boxes, shapes, etc., it is sometimes challenging to select one of the objects - it can lay behind other objects, or it can be too small, etc.
Word proposes an excellent feature named Selection pane to help navigate between different objects and groups.
Word proposes an excellent feature named Selection pane to help navigate between different objects and groups.
How to make a background with a chalk or marker effect
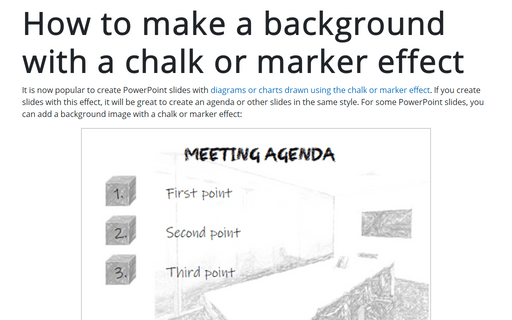
It is now popular to create PowerPoint slides with diagrams or charts drawn using the chalk or marker effect. If you create slides with this effect, it will be great to create an agenda or other slides in the same style. For some PowerPoint slides, you can add a background image with a chalk or marker effect:
How to crop a picture to fit a shape
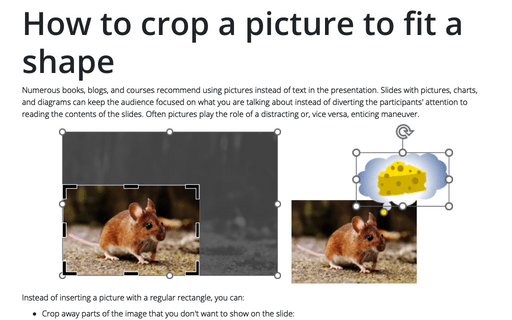
Numerous books, blogs, and courses recommend using pictures instead of text in the presentation. Slides with pictures, charts, and diagrams can keep the audience focused on what you are talking about instead of diverting the participants' attention to reading the contents of the slides. Often pictures play the role of a distracting or, vice versa, enticing maneuver.
How to create a timeline using SmartArt
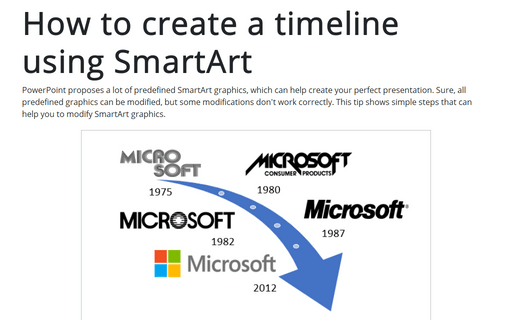
PowerPoint proposes a lot of predefined SmartArt graphics, which can help create your perfect presentation. Sure, all predefined graphics can be modified, but some modifications don't work correctly. This tip shows simple steps that can help you to modify SmartArt graphics.
