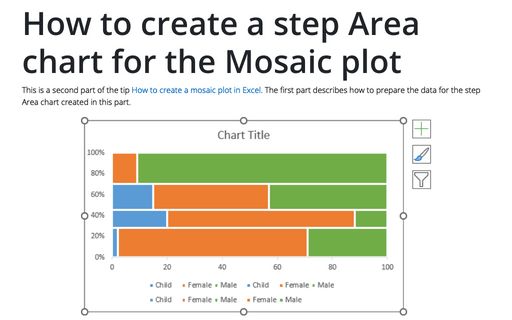
How to create a step Area chart for the Mosaic plot in Excel
This is a second part of the tip How to create a Mosaic plot in Excel. The first part describes how to prepare the data for the step Area chart created in this part.
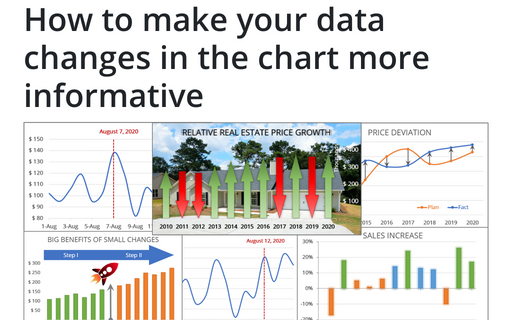
How to make your data changes in the chart more informative
Simple line and bar charts often attract little or no interest in the audience. Still, Excel allows you to attract attention to your data by emphasizing change direction, difference, or period.
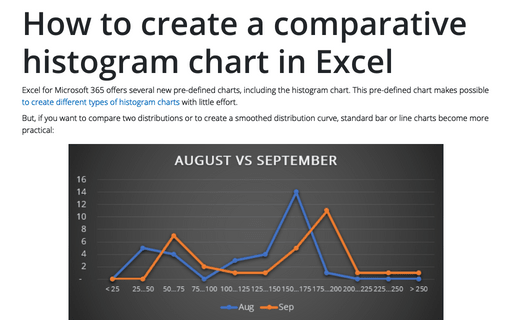
How to create a comparative histogram chart in Excel
Excel for Microsoft 365 offers several new pre-defined charts, including the histogram chart. This pre-defined chart makes possible to create different types of histogram charts with little effort.
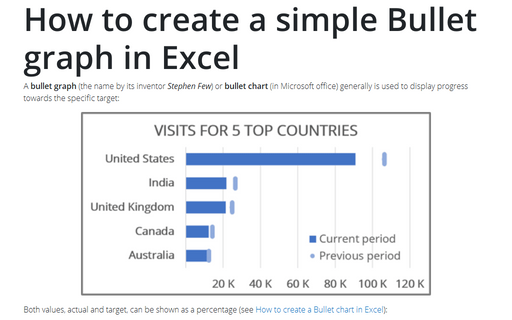
How to create a simple Bullet graph in Excel
A bullet graph (the name by its inventor Stephen Few) or bullet chart (in Microsoft office) generally is used to display progress towards the specific target:
Creating a gauge chart
A gauge, dial, or speedometer chart displays a value between 0 and 100%. Where the Goal is 100%, and the displayed value is a fraction of the Goal. The actual value can be displayed as a percentage or as a number:
How to create a Scrolling chart
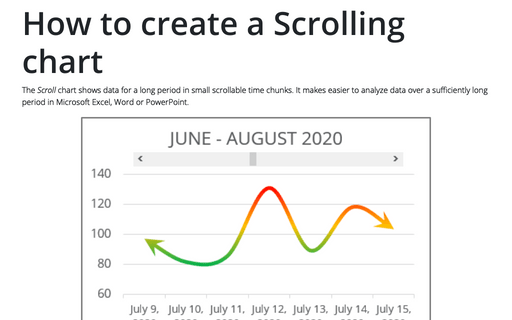
The Scroll chart shows data for a long period in small scrollable time chunks. It makes easier to analyze data over a sufficiently long period in Microsoft Excel, Word or PowerPoint.
The Scroll chart displays some contiguous range of data from a large dataset. Using the provided Control tools, it is possible to add a scroll bar to the chart area and view the desired data range:
The Scroll chart displays some contiguous range of data from a large dataset. Using the provided Control tools, it is possible to add a scroll bar to the chart area and view the desired data range:
Speedometer chart
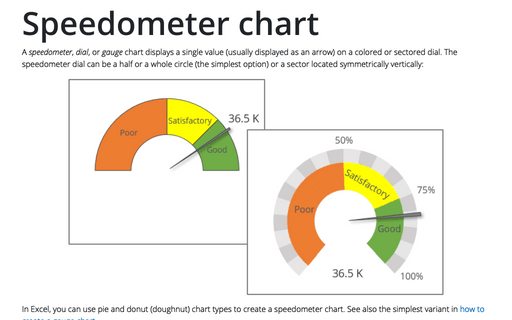
A speedometer, dial, or gauge chart displays a single value (usually displayed as an arrow) on a colored or sectored dial. The speedometer dial can be a half or a whole circle (the simplest option) or a sector located symmetrically vertically:
Combining several charts into one chart
If you want to combine more than two different data series with common horizontal and different vertical values, you could not just add another axis to the chart. You need to combine several charts into one chart.
Progress Gantt chart with events
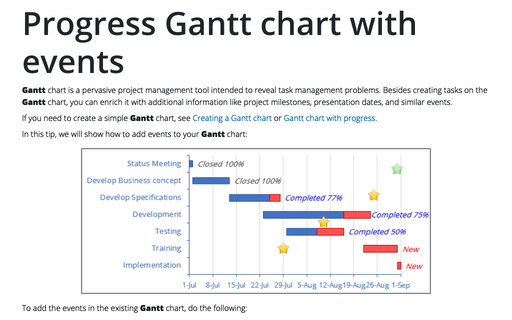
Gantt chart is a pervasive project management tool intended to reveal task management problems. Besides creating tasks on the Gantt chart, you can enrich it with additional information like project milestones, presentation dates, and similar events.
Customize the vertical axis labels
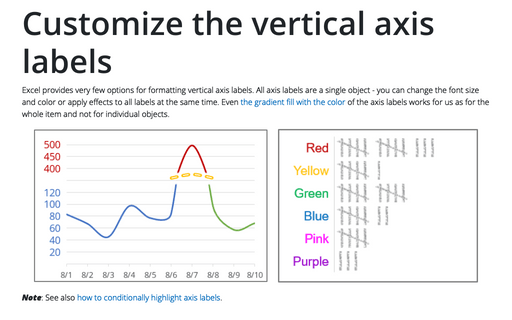
Excel provides very few options for formatting vertical axis labels. All axis labels are a single object - you can change the font size and color or apply effects to all labels at the same time. Even the gradient fill with the color of the axis labels works for us as for the whole item and not for individual objects.
