Competition chart with residual data
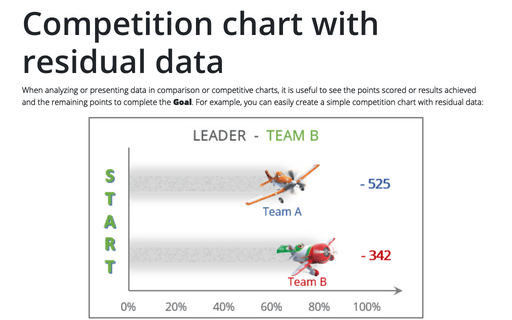
When analyzing or presenting data in comparison or competitive charts, it is useful to see the points scored or results achieved and the remaining points to complete the Goal. For example, you can easily create a simple competition chart with residual data:
Text formatting in PowerPoint
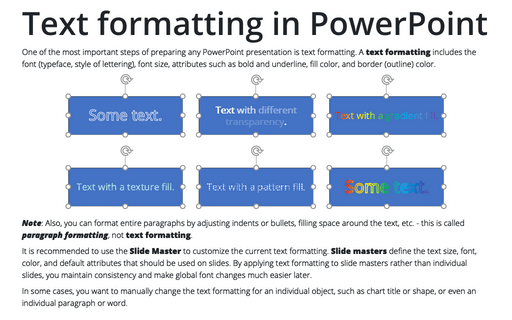
One of the most important steps of preparing any PowerPoint presentation is text formatting. A text formatting includes the font (typeface, style of lettering), font size, attributes such as bold and underline, fill color, and border (outline) color.
A radar chart for personality assessment test visualization
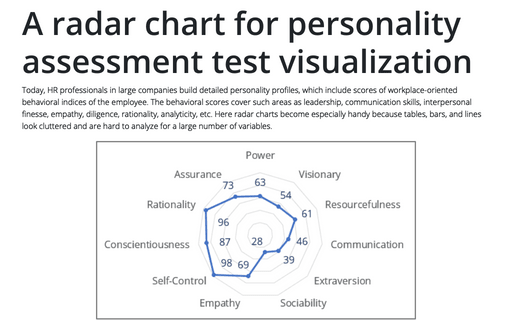
Today, HR professionals in large companies build detailed personality profiles, which include scores of workplace-oriented behavioral indices of the employee. The behavioral scores cover such areas as leadership, communication skills, interpersonal finesse, empathy, diligence, rationality, analyticity, etc.
Gantt chart with progress or progress Gantt chart
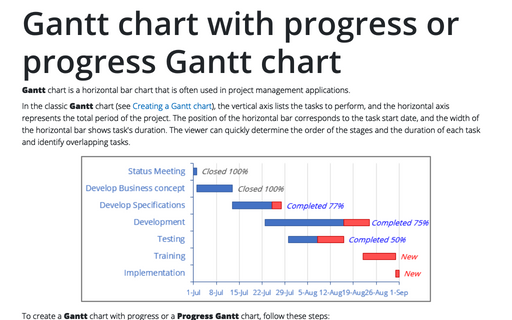
Gantt chart is a horizontal bar chart that is often used in project management
applications.
Adding error bars
For certain chart types, you can add error bars to your chart. Error bars often are used to indicate "plus or minus" information that reflects uncertainty in the data.
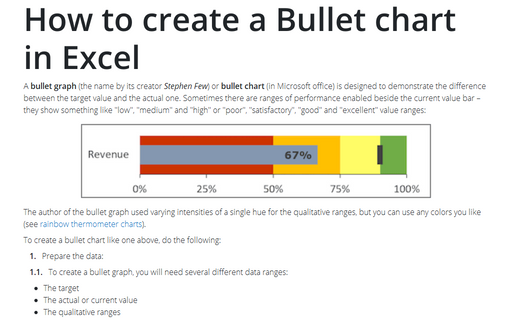
How to create a Bullet chart in Excel
A bullet graph (the name by its creator Stephen Few) or bullet chart (in Microsoft office) is designed to demonstrate the difference between the target value and the actual one. Sometimes there are ranges of performance enabled beside the current value bar – they show something like "low", "medium" and "high" or "poor", "satisfactory", "good" and "excellent" value ranges:
Conditional formatting for chart axes
One of the useful tricks to attain the attention of the audience and improve the effect of presenting your data is to use axis label formatting customized for the specific value ranges:
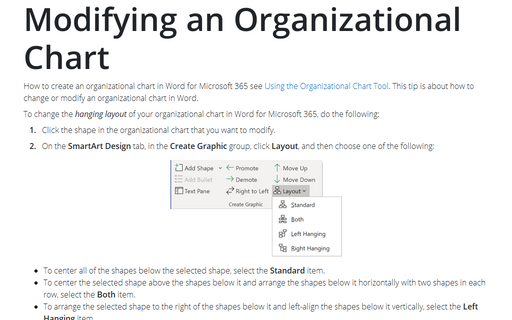
Modifying an Organizational Chart
How to create an organizational chart in Word for Microsoft 365 see Using the Organizational Chart Tool.
This tip is about how to change or modify an organizational chart in Word.
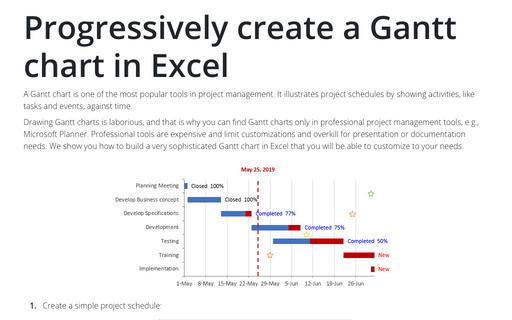
Progressively create a Gantt chart in Excel
A Gantt chart is one of the most popular tools in project management. It illustrates project schedules
by showing activities, like tasks and events, against time.
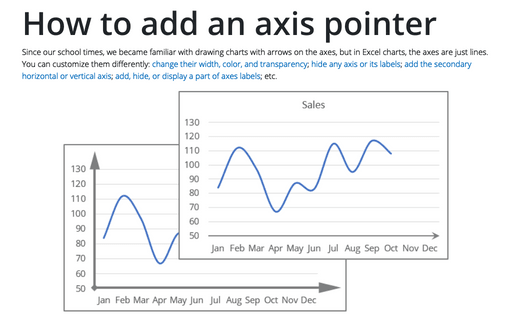
How to add an axis pointer
Since our school times, we became familiar with drawing charts with arrows on the axes, but in Excel charts, the axes are just lines. You can customize them differently: change their width, color, and transparency; hide any axis or its labels; add the secondary horizontal or vertical axis; add, hide, or display a part of axes labels; etc.
