How to stop AutoCorrect and AutoFormat changes
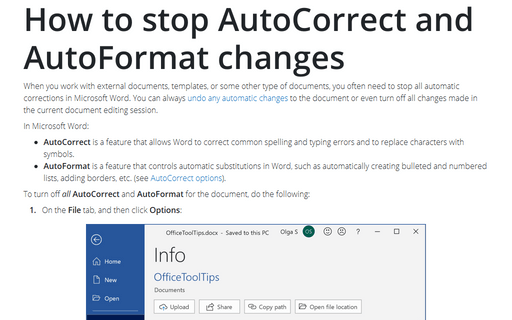
When you work with external documents, templates, or some other type of documents, you often need to stop all automatic corrections in Microsoft Word. You can always undo any automatic changes to the document or even turn off all changes made in the current document editing session.
How to add text to the connector in the flowchart
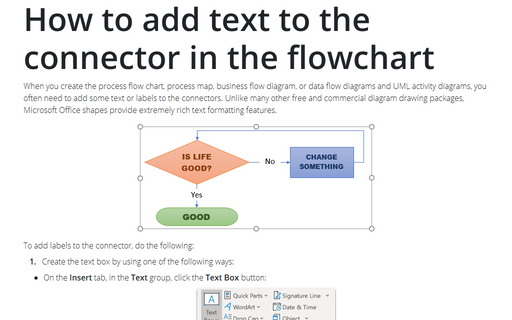
When you create the process flow chart, process map, business flow diagram, or data flow diagrams and UML
activity diagrams, you often need to add some text or labels to the connectors. Unlike many other free and
commercial diagram drawing packages, Microsoft Office shapes provide extremely rich text formatting
features.
How to personalize the new email notification options in Outlook for Windows
When Outlook receives new messages, meeting requests, or task assignments, it can alert you in several different ways. This will help you stay on top of your email activity if you're using another app, work with two or even more monitors, or are away from your computer.
Working with headers and footers
Requirements for book, reports, thesis, and other documents, in addition to page numbers, demand a piece of additional document information located at the top or bottom of each page. To display duplicating information such as a document title, author or responsible person name, date of the last modification, etc., use the Header at the top of every page or the Footer at the bottom of every page.
How to create and modify tables in Word
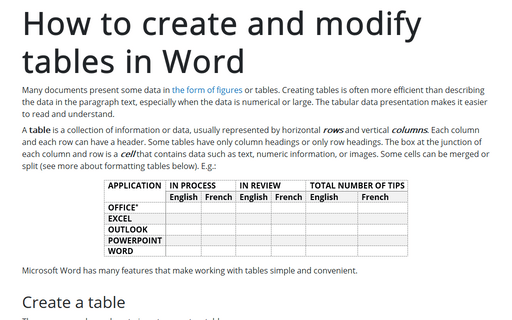
Many documents present some data in the form of figures or tables. Creating tables is often more efficient than describing the data in the paragraph text, especially when the data is numerical or large. The tabular data presentation makes it easier to read and understand.
How to create a cycle flow chart using four arrows in a circle
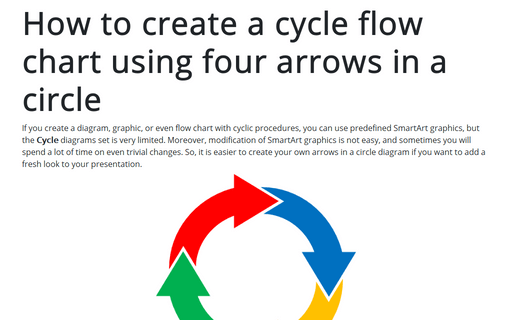
If you create a diagram, graphic, or even flow chart with cyclic procedures, you can use predefined SmartArt graphics, but the Cycle diagrams set is very limited. Moreover, modification of SmartArt graphics is not easy, and sometimes you will spend a lot of time on even trivial changes. So, it is easier to create your own arrows in a circle diagram if you want to add a fresh look to your presentation.
Creating and using named ranges
Named ranges (also known as defined ranges) are a powerful feature in Excel that allows you to assign a symbolic name to a cell, range of cells, or formula. These defined names are a convenient replacement for the address of a cell, data range, or formula in other formulas, charts, diagrams, shapes, etc.
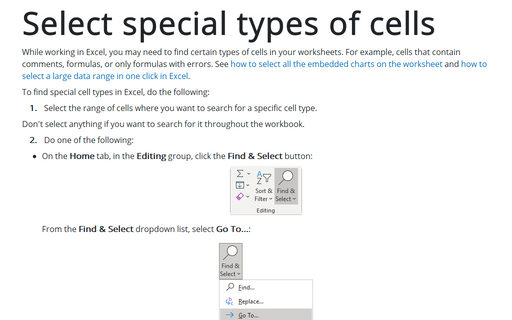
Select special types of cells
While working in Excel, you may need to find certain types of cells in your worksheets. For example, cells that contain comments, formulas, or only formulas with errors. See how to select all the embedded charts on the worksheet and how to select a large data range in one click in Excel.
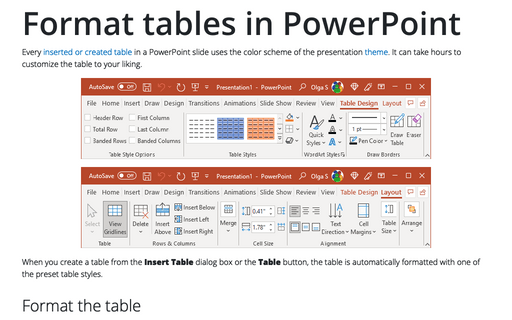
Format tables in PowerPoint
Every inserted or created table in a PowerPoint slide uses the color scheme of the presentation theme. It can take hours to customize the table to your liking.
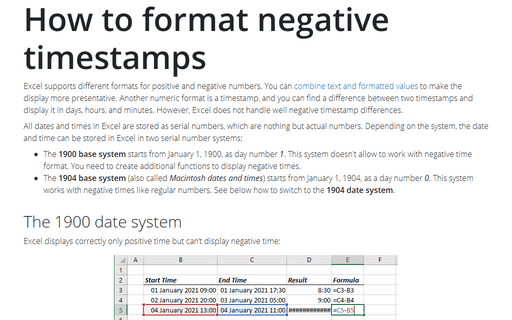
How to format negative timestamps
Excel supports different formats for positive and negative numbers. You can combine text and formatted values to make the display more presentative. Another numeric format is a timestamp, and you can find a difference between two timestamps and display it in days, hours, and minutes. However, Excel does not handle well negative timestamp differences.
