How to create a timeline using SmartArt
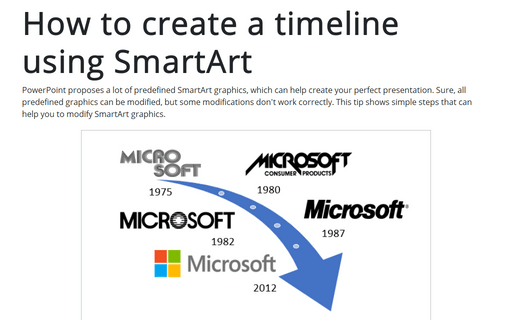
PowerPoint proposes a lot of predefined SmartArt graphics, which can help create your perfect presentation. Sure, all predefined graphics can be modified, but some modifications don't work correctly. This tip shows simple steps that can help you to modify SmartArt graphics.
How to change flowchart shapes in Excel
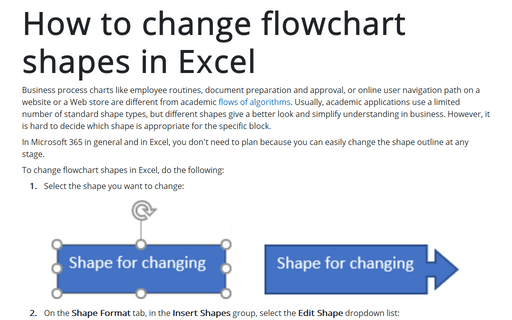
Business process charts like employee routines, document preparation and approval, or online user navigation path on a website or a Web store are different from academic flows of algorithms. Usually, academic applications use a limited number of standard shape types, but different shapes give a better look and simplify understanding in business. However, it is hard to decide which shape is appropriate for the specific block.
How to create an automatically extended or dynamic drop-down list
When you work with data in Excel, you often need to add more and more new data. However, it takes some time to update formulas, charts, and tables when adding new data. Excel proposes functions that can help customize your data and avoid routine updating. This tip is about creating an automatically extended (also known as dynamically updated or just dynamic) drop-down list.
How to change flowchart shapes
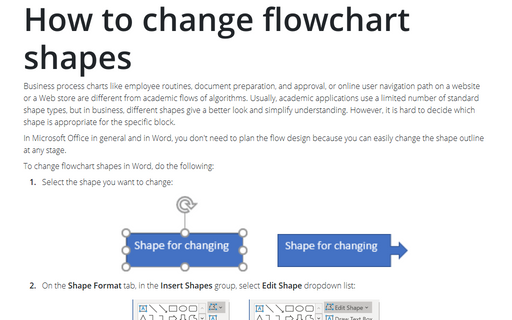
Business process charts like employee routines, document preparation, and approval, or online user navigation
path on a website or a Web store are different from academic flows of algorithms. Usually, academic
applications use a limited number of standard shape types, but in business, different shapes give a better
look and simplify understanding. However, it is hard to decide which shape is appropriate for the specific
block.
How to add the effect of falling-out pieces of a Jigsaw puzzle
The Jigsaw puzzle is a perfect illustration of a seemingly solid but unstable structure. The building up or disintegrating of such structures serves a good illustration of many business processes.
How to create Table of Figures and List of Tables
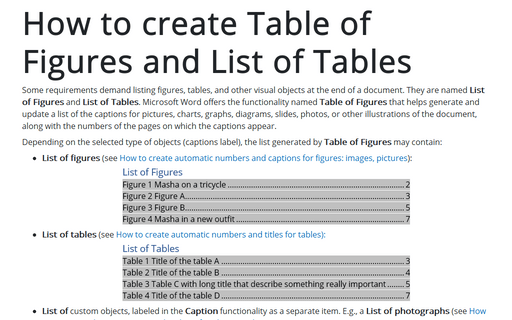
Some requirements demand listing figures, tables, and other visual objects at the end of a document. They are named List of Figures and List of Tables. Microsoft Word offers the functionality named Table of Figures that helps generate and update a list of the captions for pictures, charts, graphs, diagrams, slides, photos, or other illustrations of the document, along with the numbers of the pages on which the captions appear.
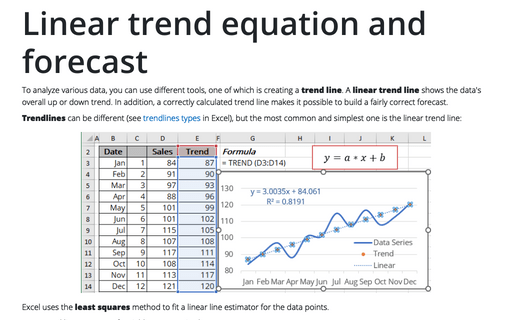
Linear trend equation and forecast
To analyze various data, you can use different tools, one of which is creating a trend line. A linear trend line shows the data's overall up or down trend. In addition, a correctly calculated trend line makes it possible to build a fairly correct forecast.
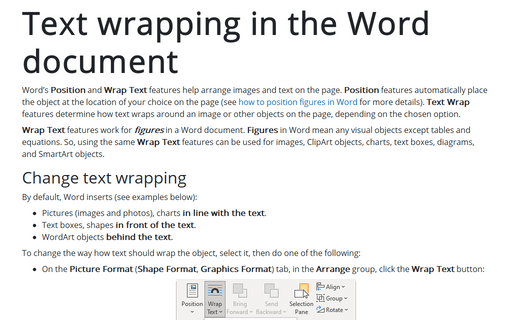
Text wrapping in the Word document
Word's Position and Wrap Text features help arrange images and text on the page. Position features automatically place the object at the location of your choice on the page (see how to position figures in Word for more details). Text Wrap features determine how text wraps around an image or other objects on the page, depending on the chosen option.
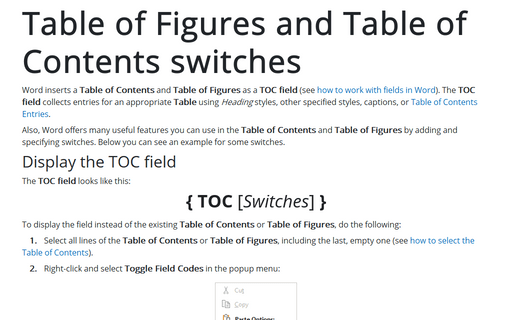
Table of Figures and Table of Contents switches
Word inserts a Table of Contents and Table of Figures as a TOC field (see how to work with fields in Word). The TOC field collects entries for an appropriate Table using Heading styles, other specified styles, captions, or Table of Contents Entries.
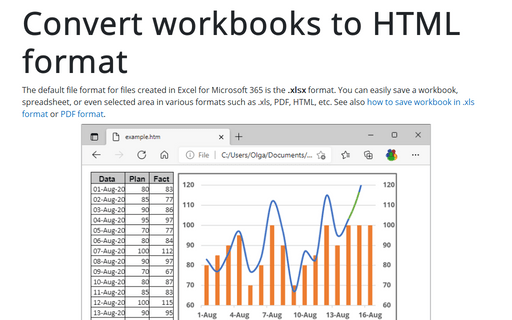
Convert workbooks to HTML format
The default file format for files created in Excel for Microsoft 365 is the .xlsx format. You can easily save a workbook, spreadsheet, or even selected area in various formats such as .xls, PDF, HTML, etc. See also how to save workbook in .xls format or PDF format.
