How to turn on or turn off automatic generation of Alternative text for pictures
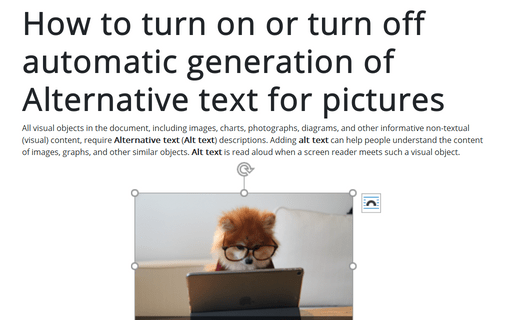
All visual objects in the document, including images, charts, photographs, diagrams, and other informative non-textual (visual) content, require Alternative text (Alt text) descriptions. Adding alt text can help people understand the content of images, graphs, and other similar objects. Alt text is read aloud when a screen reader meets such a visual object.
How to work with a large number of objects in Word
When you work with many graphical objects such as pictures, charts, text boxes, shapes, etc., it is sometimes challenging to select one of the objects - it can lay behind other objects, or it can be too small, etc.
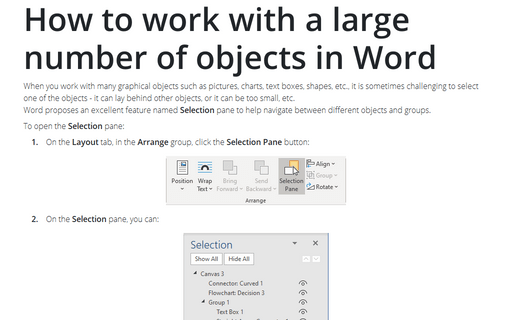
Word proposes an excellent feature named Selection pane to help navigate between different objects and groups.
Word proposes an excellent feature named Selection pane to help navigate between different objects and groups.
How to insert multiplication symbol and division sign in Word
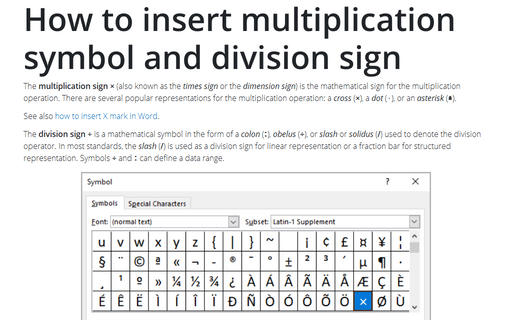
The multiplication sign × (also known as the times sign or the dimension sign) is the mathematical sign for the multiplication operation. There are several popular representations for the multiplication operation: a cross (×), a dot (⋅), or an asterisk (∗).
How to make a background with a chalk or marker effect
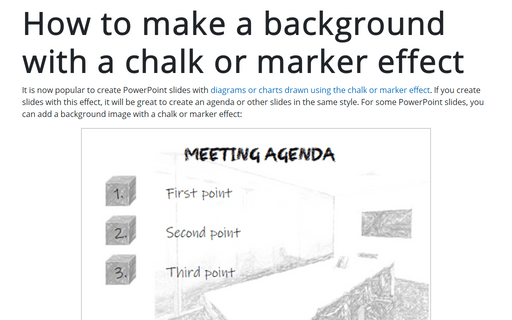
It is now popular to create PowerPoint slides with diagrams or charts drawn using the chalk or marker effect. If you create slides with this effect, it will be great to create an agenda or other slides in the same style. For some PowerPoint slides, you can add a background image with a chalk or marker effect:
How to crop a picture to fit a shape
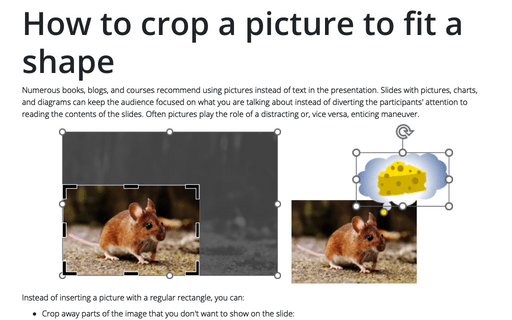
Numerous books, blogs, and courses recommend using pictures instead of text in the presentation. Slides with pictures, charts, and diagrams can keep the audience focused on what you are talking about instead of diverting the participants' attention to reading the contents of the slides. Often pictures play the role of a distracting or, vice versa, enticing maneuver.
Adding and removing page breaks
Usually, all workbooks are opened in the Normal view in Excel. Thus, page breaks aren't displayed until you print (or preview) the spreadsheet or entire workbook at least one time. In a preview, horizontal and vertical dotted lines indicate the page breaks:
How to create a timeline using SmartArt
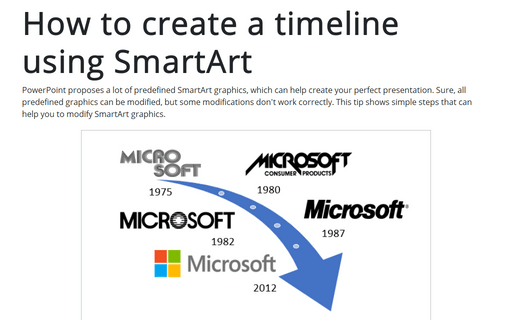
PowerPoint proposes a lot of predefined SmartArt graphics, which can help create your perfect presentation. Sure, all predefined graphics can be modified, but some modifications don't work correctly. This tip shows simple steps that can help you to modify SmartArt graphics.
How to change flowchart shapes in Excel
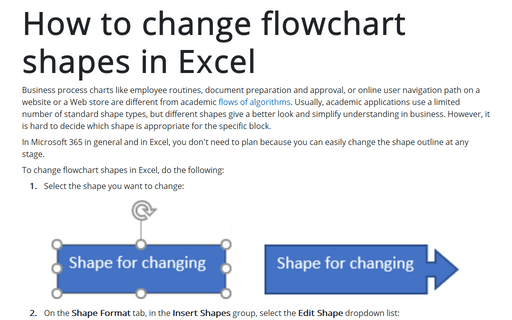
Business process charts like employee routines, document preparation and approval, or online user navigation path on a website or a Web store are different from academic flows of algorithms. Usually, academic applications use a limited number of standard shape types, but different shapes give a better look and simplify understanding in business. However, it is hard to decide which shape is appropriate for the specific block.
How to create an automatically extended or dynamic drop-down list
When you work with data in Excel, you often need to add more and more new data. However, it takes some time to update formulas, charts, and tables when adding new data. Excel proposes functions that can help customize your data and avoid routine updating. This tip is about creating an automatically extended (also known as dynamically updated or just dynamic) drop-down list.
How to change flowchart shapes
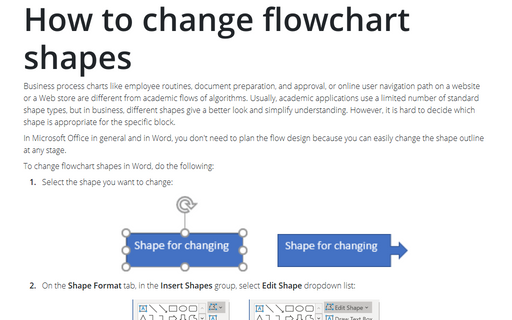
Business process charts like employee routines, document preparation, and approval, or online user navigation
path on a website or a Web store are different from academic flows of algorithms. Usually, academic
applications use a limited number of standard shape types, but in business, different shapes give a better
look and simplify understanding. However, it is hard to decide which shape is appropriate for the specific
block.
