How to create two vertical axes on the same side
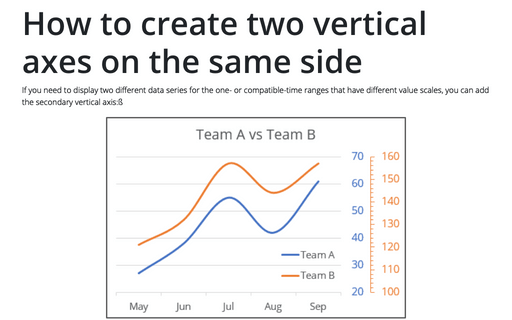
If you need to display two different data series for the one- or compatible-time ranges that have different value scales, you can add the secondary vertical axis:ß
Progress Gantt chart with events
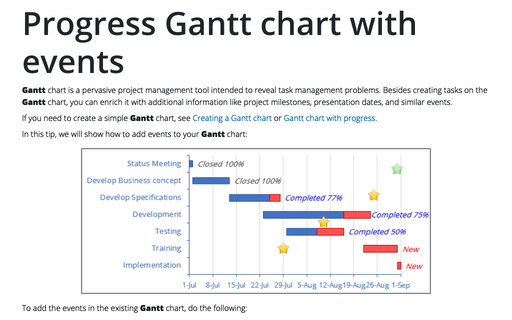
Gantt chart is a pervasive project management tool intended to reveal task management problems. Besides creating tasks on the Gantt chart, you can enrich it with additional information like project milestones, presentation dates, and similar events.
Text effects
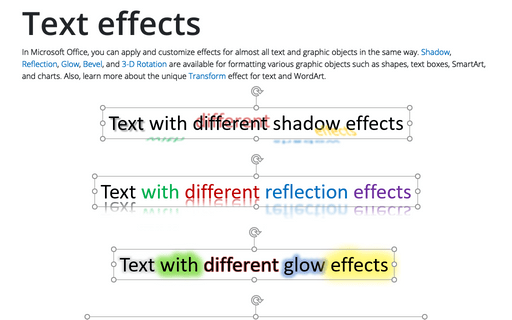
In Microsoft Office, you can apply and customize effects for almost all text and graphic objects in the same way. Shadow, Reflection, Glow, Bevel, and 3-D Rotation are available for formatting various graphic objects such as shapes, text boxes, SmartArt, and charts. Also, learn more about the unique Transform effect for text and WordArt.
How to freeze charts, shapes, text boxes, and other objects in Excel
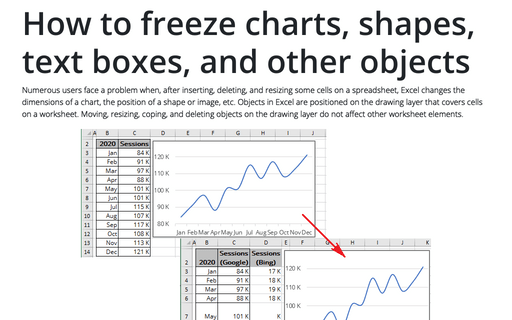
Numerous users face a problem when, after inserting, deleting, and resizing some cells on a spreadsheet, Excel changes the dimensions of a chart, the position of a shape or image, etc. Objects in Excel are positioned on the drawing layer that covers cells on a worksheet.
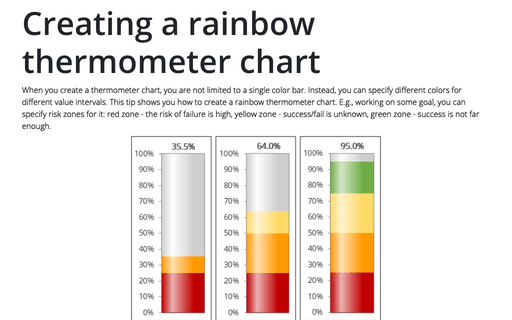
Creating a rainbow thermometer chart
When you create a thermometer chart, you are not limited to a single color bar. Instead, you can specify different colors for different value intervals. This tip shows you how to create a rainbow thermometer chart. E.g., working on some goal, you can specify risk zones for it: red zone - the risk of failure is high, yellow zone - success/fail is unknown, green zone - success is not far enough.
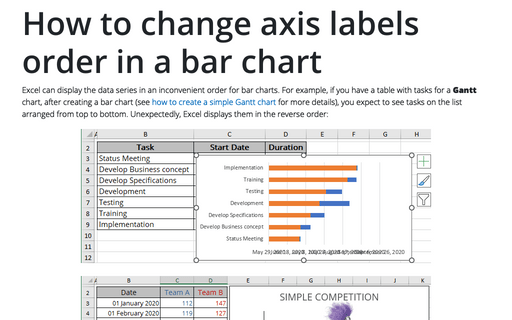
How to change axis labels order in a bar chart
Excel can display the data series in an inconvenient order for bar charts. For example, if you have a table with tasks for a Gantt chart, after creating a bar chart (see how to create a simple Gantt chart for more details), you expect to see tasks on the list arranged from top to bottom. Unexpectedly, Excel displays them in the reverse order:
What Excel Skills are Useful to Include in a Resume?
Microsoft Excel is an integral part of today's business environment and many professional fields. This software product has become the most popular tool for data processing, analysis, and data visualization. Every day, millions of professionals around the world use Excel to solve problems of varying complexity. Excel skills often play a key role in hiring decisions. So, they can be your competitive advantage.
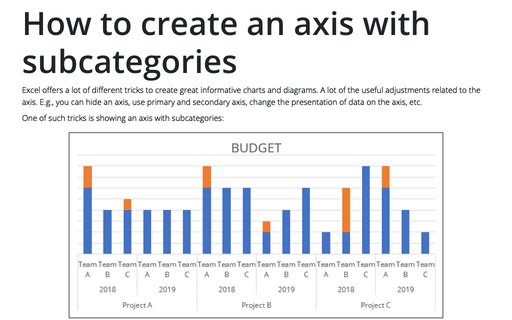
How to create an axis with subcategories
Excel offers a lot of different tricks to create great informative charts and diagrams. A lot of
the useful adjustments related to the axis. E.g., you can hide an axis, use primary and
secondary axis, change the presentation of data on the axis, etc.
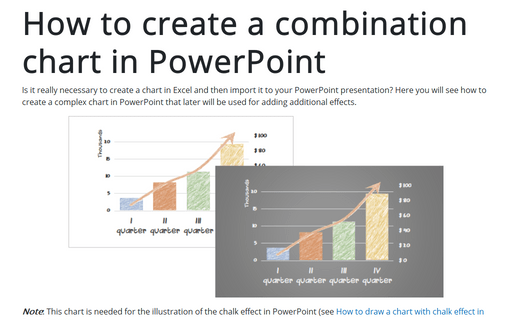
How to create a combination chart in PowerPoint
Is it really necessary to create a chart in Excel and then import it to your PowerPoint presentation? Here you will see how to create a complex chart in PowerPoint that later will be used for adding additional effects.
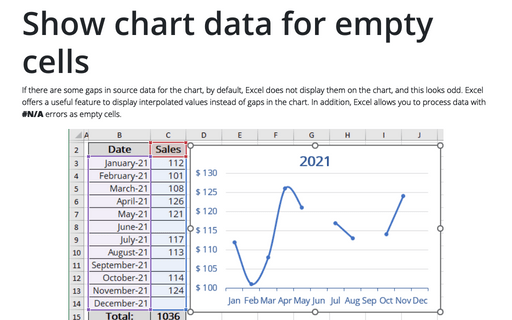
Show chart data for empty cells
If there are some gaps in source data for the chart, by default, Excel does not display them on the chart, and this looks odd. Excel offers a useful feature to display interpolated values instead of gaps in the chart. In addition, Excel allows you to process data with #N/A errors as empty cells.
