Shape in PowerPoint 365
How to create 3D realistic Jigsaw pieces using PowerPoint shapes
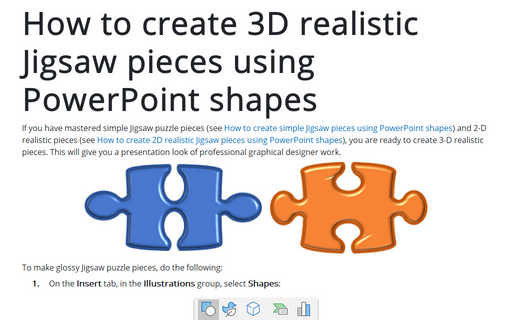
If you have mastered simple Jigsaw puzzle pieces (see How to create simple Jigsaw pieces using PowerPoint shapes) and 2-D realistic pieces (see How to create 2D realistic Jigsaw pieces using PowerPoint shapes), you are ready to create 3-D realistic pieces. This will give you a presentation look of professional graphical designer work.
How to create 2D realistic Jigsaw pieces using PowerPoint shapes
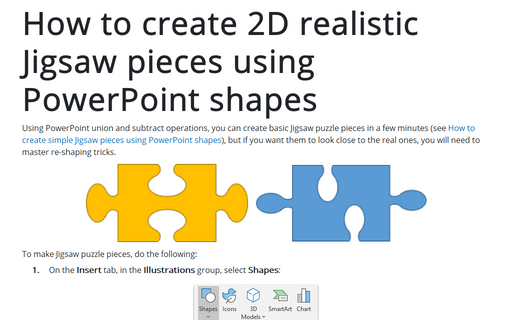
Using PowerPoint union and subtract operations, you can create basic Jigsaw puzzle pieces in a few minutes (see How to create simple Jigsaw pieces using PowerPoint shapes). But if you want them to look close to the real ones, you will need to master re-shaping tricks.
How to create simple Jigsaw pieces using PowerPoint shapes
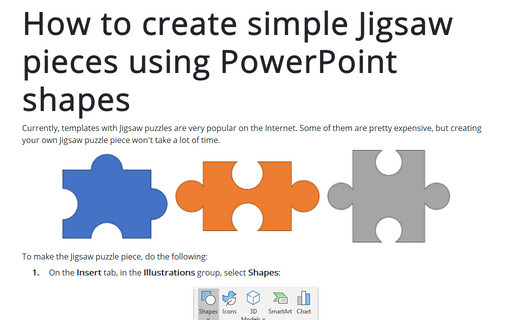
Currently, templates with Jigsaw puzzles are very popular on the Internet. Some of them are pretty expensive, but creating your own Jigsaw puzzle piece won't take a lot of time.
How to create a timeline in PowerPoint
If you show historical data, creating a timeline chart is often more informative. Several different predefined SmartArt graphics can be used for timeline charts.
This tip shows simple steps for creating a simple and informative timeline using Microsoft logo design changes (see https://en.wikipedia.org/wiki/Microsoft#Logo).
This tip shows simple steps for creating a simple and informative timeline using Microsoft logo design changes (see https://en.wikipedia.org/wiki/Microsoft#Logo).
How to create a timeline using SmartArt
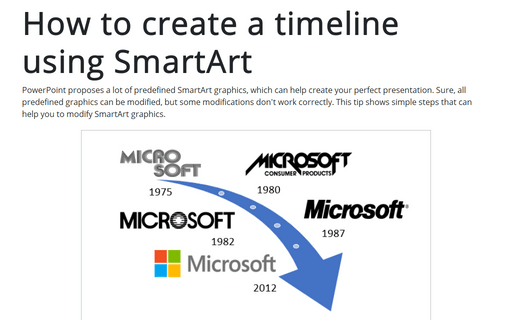
PowerPoint proposes a lot of predefined SmartArt graphics, which can help create your perfect presentation. Sure, all predefined graphics can be modified, but some modifications don't work correctly. This tip shows simple steps that can help you to modify SmartArt graphics.
How to stress cyclic processes using two arrow circle diagram
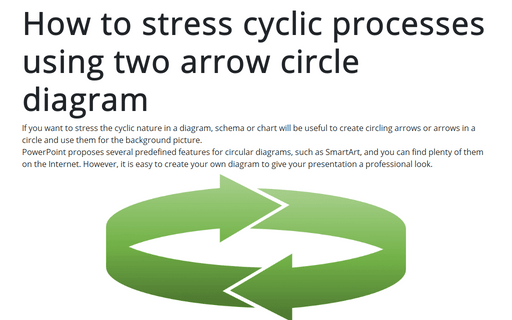
If you want to stress the cyclic nature in a diagram, schema or chart will be useful to create circling arrows or arrows in a circle and use them for the background picture.
PowerPoint proposes several predefined features for circular diagrams, such as SmartArt, and you can find plenty of them on the Internet. However, it is easy to create your own diagram to give your presentation a professional look.
PowerPoint proposes several predefined features for circular diagrams, such as SmartArt, and you can find plenty of them on the Internet. However, it is easy to create your own diagram to give your presentation a professional look.
How to create a cycle flow chart using four arrows in a circle
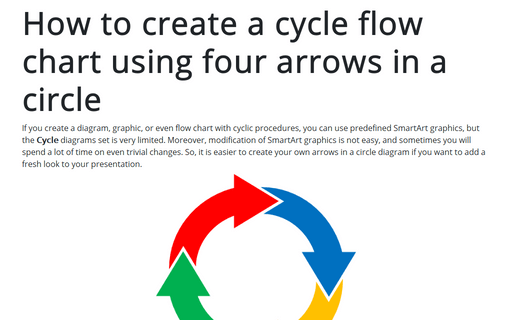
If you create a diagram, graphic, or even flow chart with cyclic procedures, you can use predefined SmartArt graphics, but the Cycle diagrams set is very limited. Moreover, modification of SmartArt graphics is not easy, and sometimes you will spend a lot of time on even trivial changes. So, it is easier to create your own arrows in a circle diagram if you want to add a fresh look to your presentation.
How to use 3D cubes for numbering
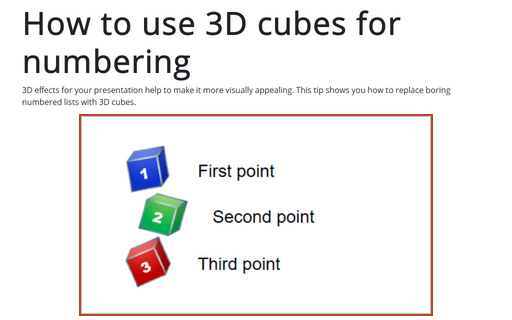
3D effects for your presentation help to make it more visually appealing. This tip shows you how to replace boring numbered lists with 3D cubes.
How to create a custom shape
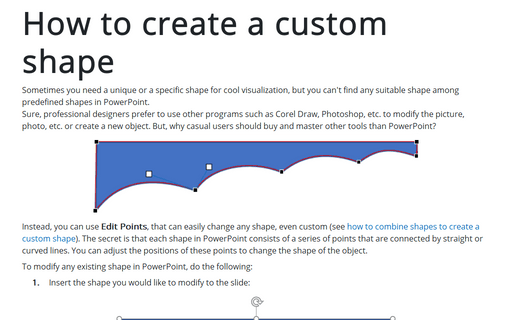
Sometimes you need a unique or a specific shape for cool visualization, but you can't find any suitable shape among predefined shapes in PowerPoint.
Sure, professional designers prefer to use other programs, such as Corel Draw, Photoshop, etc., to modify the picture, the photo, etc., or create a new object. But why should casual users buy and master tools other than PowerPoint?
Sure, professional designers prefer to use other programs, such as Corel Draw, Photoshop, etc., to modify the picture, the photo, etc., or create a new object. But why should casual users buy and master tools other than PowerPoint?
How to combine shapes to create a custom shape
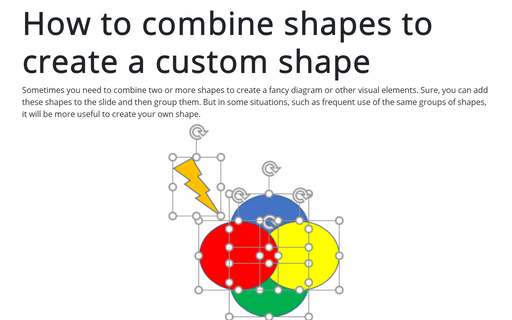
Sometimes you need to combine two or more shapes to create a fancy diagram or other visual elements. Sure, you can add these shapes to the slide and then group them. But in some situations, such as frequent use of the same groups of shapes, it will be more useful to create your own shape.
