How to view current stock prices and other quotes in Excel
Today Microsoft offers a new way to add and update some stock information, such as stock prices, changes in price, etc.:

If you need to add only the actual or historical stock data (open, high, low, close prices, and volume) to your spreadsheet, see How to view historical stock prices in Excel.
To add the actual and updatable stock information into the Excel spreadsheet, do the following:
Select the Stock Data Type
1. Type ticker symbols or company names for which you want to add stock information.
2. Select these cells.
For example:

3. On the Data tab, in the Data Types group, click Stocks:

Excel will try to convert the selected text to the Stocks data type. If the transformation was successful (Excel found in the Microsoft online source a matching stock data for the value in the cell), the cell data have the stock icon ![]() :
:

Note: For some data (in this example, for Facebook), Excel can't find the appropriate stock record in Microsoft online sources. It can happen due to spelling mistakes or when Excel needs your help interpreting the stock correctly. In this case, click on the question icon ![]() to open the Data Selector pane:
to open the Data Selector pane:

- Modify the name in the field on the top if there is a spelling error, and click the find icon
 .
.
For this example:

- Select the appropriate stock data if there are several stock markets/exchanges for the stock ticker or name:

Excel displays the selected stock data:

Add the stock information
4. Select one or more cells with the Stocks data type
(with the stock icon ![]() ) and click the Insert Data button
) and click the Insert Data button ![]() :
:

From the drop-down list, select the data that you want to add to the spreadsheet.
5. Click the Insert Data button again and add more data columns.
For example:

Notes:
- To see all of the fields available for a company or fund, click the stock icon
 or select the cell and press Ctrl+Shift+F5:

- To refresh data type, do one of the following:
- On the Data tab, in the group Queries & Connections, click the Refresh All button:

- Right-click the stock data (cells with stock icon
 ) and choose Data Type -> Refresh in the popup menu:
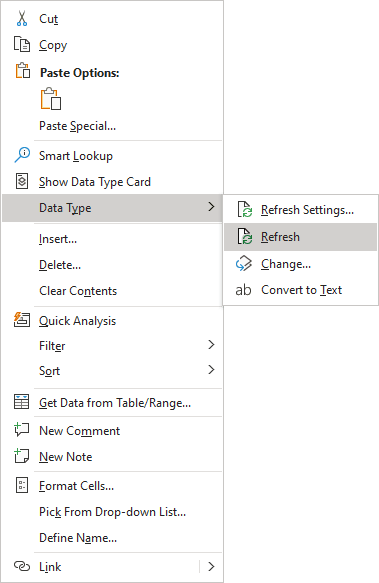
This command refreshes all data types in the workbook (stock, currencies, geography, etc.), not just the current spreadsheet!
- On the Data tab, in the group Queries & Connections, click the Refresh All button:
- To change the Stocks data, right-click on the cell with this data type you want to change (cells with stock icon
 ) and choose Data Type -> Change... in the popup menu.
This command opens the Data Selector pane to type or select another data (see how to work in this pane above).
The Change... command in the popup menu is available if you select only one Stock data element.
- To fix or change the Stocks data type to the regular text, right-click on the the data that you want to fix (cells with stock icon
 ), then choose Data Type -> Convert to Text in the popup menu.
This command converts the Stocks data type to the regular text, and all dependent data won't be shown anymore:

To save all dependent data, before converting the Stocks data type, do the following:
- Select all dependent data that you want to save and copy it to the Clipboard (by clicking the Copy button on the Home tab, in the Clipboard group, or by pressing Ctrl+C).
- On the Home tab, in the Clipboard group, click Paste, and then select one of the Paste Values buttons:
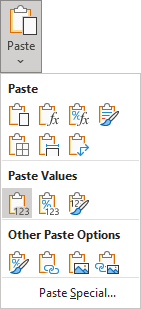
 Values (V) pastes the results of formulas. The destination for the copy can be a new or the original range. In the latter case, Excel replaces the original formulas with their current values
 Values & Number Formatting (A) pastes the results of formulas, plus the number formatting
 Values & Source Formatting (E) pastes the results of formulas, plus all formatting.
- Stock information is provided "as-is" and may be delayed. So, this data can't be used for trading purposes or advice:

- To work with stock information, you need online Internet access and an appropriate Excel version of Microsoft 365.
