Shape in Excel 2016
How to create a funny dog breeds lifespan chart in Excel
Span chart, also known as a range bar graph (range column graph),
floating bar graph, difference graph, high-low graph, used
to display the specific variable value range. Span charts are ideal for comparing ranges, and
typically, each variable represents a particular category. All values for the selected category
fall between minimal and maximal values that correspond to lower and upper bounds of the interval.
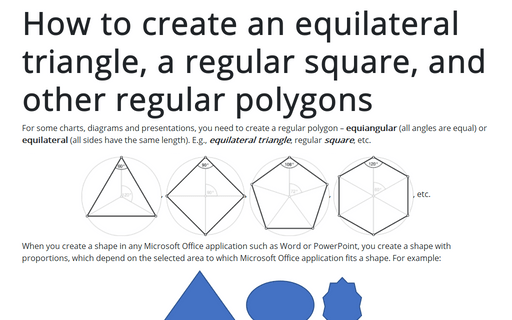
How to create an equilateral triangle, a regular square, and other regular polygons in Excel
For some charts or diagrams, you need to create a regular polygon – equiangular
(all angles are equal) or equilateral (all sides have the same length).
E.g., equilateral triangle, regular square, etc.
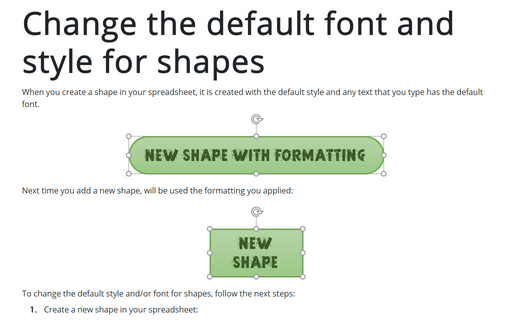
Change the default font and style for shapes in Excel
When you create a shape in your spreadsheet, it is created with the default style and any text that
you type has the default font.
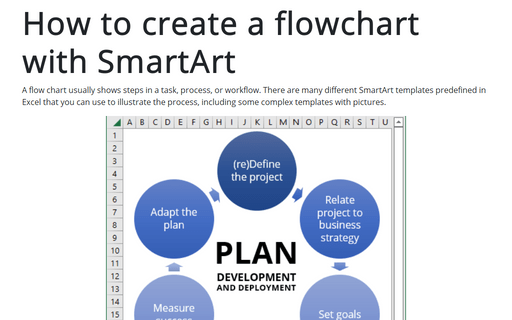
How to create a flowchart with SmartArt
A flow chart usually shows steps in a task, process, or workflow. There are many different SmartArt templates
predefined in Excel that you can use to illustrate the process, including some complex templates with
pictures.
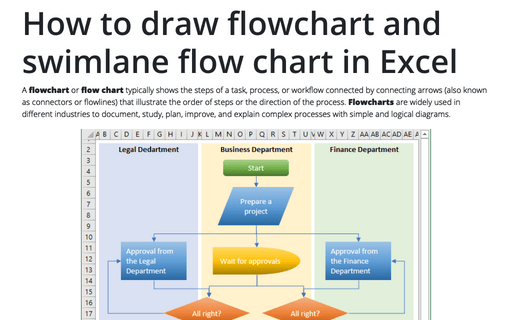
How to draw flowchart and swimlane flow chart in Excel
A flowchart or flow chart usually shows steps of the task, process, or workflow. There are many different
SmartArt templates predefined in MS Excel that you can use to illustrate the process, including visually
appealing templates with pictures.
However, if you want to use different shapes and a complex topology, it is better to create your own flowchart.
However, if you want to use different shapes and a complex topology, it is better to create your own flowchart.
How to change flowchart connector or flowline
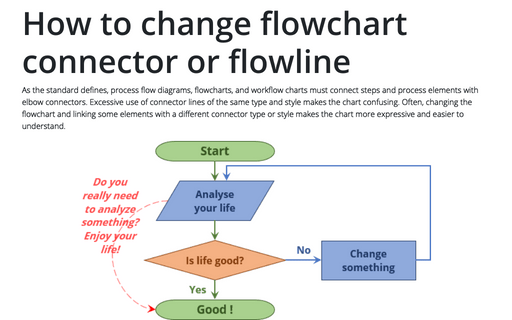
Most process flow diagrams and workflow charts use elbow connectors for connecting process stages and
elements, but too many connecting lines of the same type give your chart a messy look. Fortunately, you can
combine different connector types that represent semantically different transitions.
How to add text to the flowchart connector or flowline
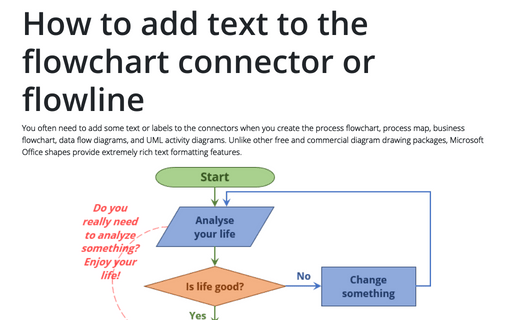
When you create the process flow chart, process map, business flow diagram or data flow diagrams, and UML
activity diagrams, you often need to add some text or labels to the connectors. Unlike other free and
commercial diagram drawing packages, Microsoft Office shapes provide extremely rich text formatting
features.
How to change flowchart shapes in Excel
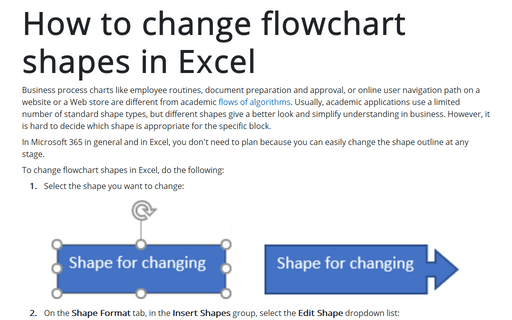
Business process charts like employee routines, document preparation and approval, or online user navigation path on a website or a Web store are different from academic flows of algorithms. Usually, academic applications use a limited number of standard shape types, but in business, different shapes give a better look and simplify understanding. However, it is hard to decide which shape is appropriate for the specific block.
How to change format for diagram shapes in Excel
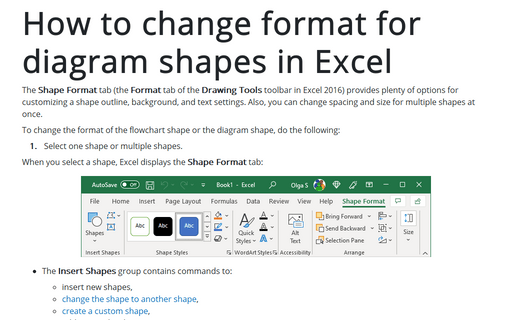
The Format tab of the Drawing Tools toolbar provides a plenty of options for customizing
a shape outline, background, and text settings. Also, you can change spacing and size for multiple shapes at
once.
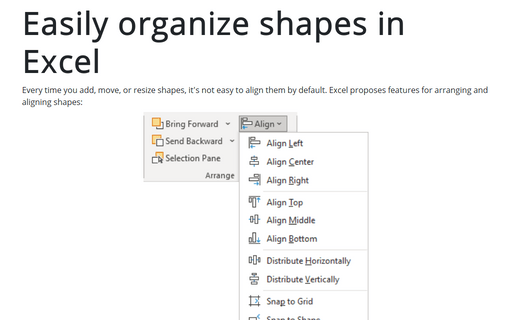
Easily organize shapes in Excel
Every time you add, move, or resize shapes, by default, it isn't easy to align them. Excel proposes features
named Snap to Shape and Snap to Grid that can help to organize shape and any objects.

