Funny thermometer Cocktail chart
Excel
2013
Do you want to make your annual company performance meeting less annoying? Create a funny cocktail chart for
it! E.g., you can mix in a glass percentage of department contribution to the company revenue.

To create the chart like this one, do the following:
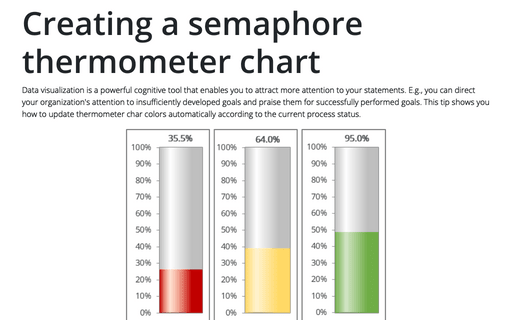
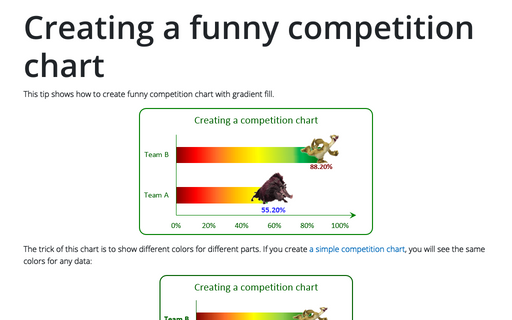
1. Create a rainbow thermometer chart (in this example, for cells C19:C23):

2. The trick of creating charts like this one is to have a transparent picture in your worksheet:
2.A. If you have a picture with gaps inside:
- just insert it:

- and move it to the front of the chart:

2.B. If you don't have a picture with gaps inside, you can create it:
- just crop parts of the picture:

- group them and move it to the front of the chart:

Make any other adjustments to get the look you desire.
See also this tip in French: Comment créer un graphique de thermomètre Cocktail.


