Excel 2013
Adding watermarks to workbook
This tip describes how to add watermark text or picture to your workbook.
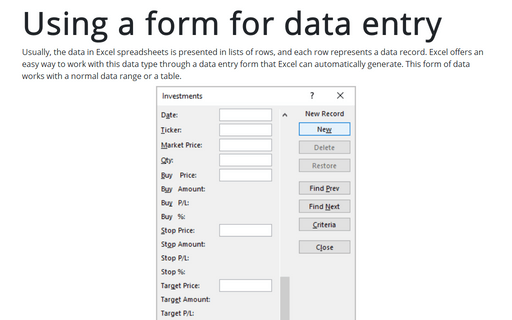
Using a form for data entry
Sometimes you need to manage lists where the information is arranged in rows. Excel offers a simple way to
work with this big data in rows.
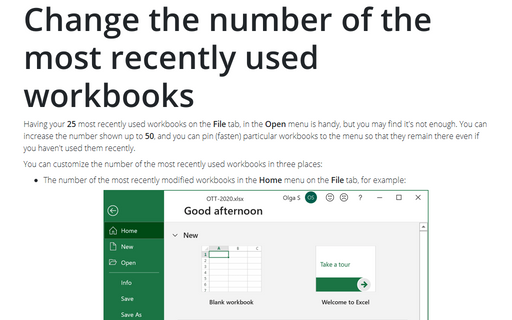
Change the number of the most recently used workbooks
Having your 25 most recently used workbooks on the File menu is handy, but you may find it's
not enough. You can increase the number shown up to 50, and you can pin (fasten) particular workbooks to the
menu so that they remain there even if you haven't used them recently.
A quick way to duplicate all of the custom chart formatting
Creation of a large number of visually consistent charts to represent different data is a time consuming and
error prone task, unless you know how to copy formatting between charts.
Creating automatically extended plot ranges
If you often need to adjust your data ranges so that your charts plot an updated data range, you may be
interested in a trick that forces Excel to update the chart's data range whenever you add new data to your
worksheet.
Creating a gauge chart
This chart resembles a speedometer gauge and displays a value between 0 and 100%.
Excel Formula auditing tools
If you would like to better understand how some of these complex array formulas work, consider using a handy
tool - Formula Evaluator:
How to avoid misleading numbers
Applying a number format to a cell doesn't change the value, but only how the value appears in the
worksheet. Formatting can play a joke with you, e.g., sum of values seems incorrect because Excel displays a
limited number of decimal places and their sum is not equal to the real sum.
Changing moving direction of the cell pointer after entering data
Excel automatically moves the cell pointer to the next cell down when you press the Enter key after
entering data into a cell, but you can change this behavior to move it up, down, left, right and even stay
on.
Using Arrows in a Chart
Expressiveness of business graphics sometimes determines the success or failure of the presentation and you
can achieve better perception of the audience by using in charts intuitively obvious representation of data
by arrows.


