Excel 2010
Shortcut key to switch between relative, absolute and mixed references
You can enter nonrelative references (absolute or mixed) manually by inserting dollar signs in the
appropriate positions, or you can use a handy shortcut - F4 key.
Using Arrows in a Chart
Expressiveness of business graphics sometimes determines the success or failure of the presentation and you
can achieve better perception of the audience by using in charts intuitively obvious representation of data
by arrows.
Creating picture charts
Excel makes it easy to incorporate a pattern, texture, or graphic file for elements in your chart. E.g., you
can create funny burger sales chart for your colleagues.
Creating and using named ranges
Range names is a powerful Excel feature which allows you to give a symbolic name for the cell or range of
cells to be later used as convenient replacement for cell/range address in formulas.
Copy formulas for selected cells fast and easy
You can use "Copy" (Ctrl+C) and "Paste" (Ctrl+V) options, but there is faster way to "copy" a formula to
multiple adjacent cells.
How to insert fractions
This tip describes how to use fractions simply.
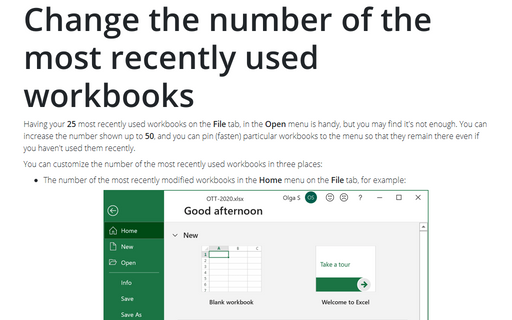
Change the number of the most recently used workbooks
Having your 25 most recently used workbooks on the File menu is handy, but you may find it's
not enough. You can increase the number shown up to 50, and you can pin (fasten) particular workbooks to the
menu so that they remain there even if you haven't used them recently.
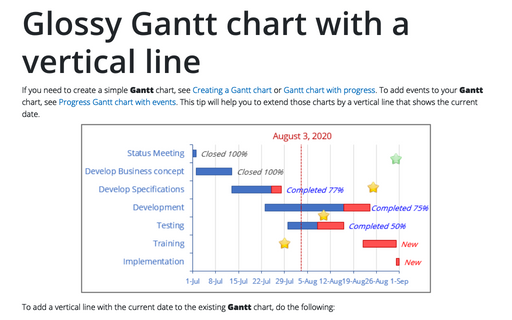
Glossy Gantt chart with a vertical line
If you need to create a simple Gantt chart, see Creating a Gantt chart or Gantt chart with progress. To add events to
your Gantt chart, see Progress Gantt chart
with events. This tip will help you to extend those charts by a vertical line that shows the current
date.
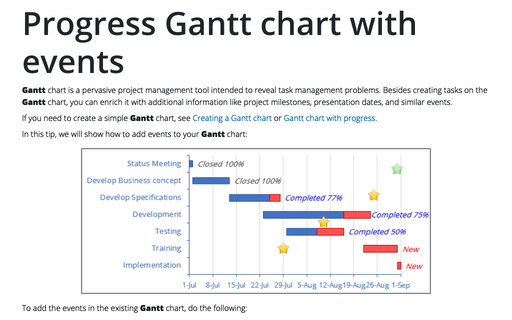
Progress Gantt chart with events
Gantt chart is a pervasive project management tool intended to reveal task management problems. But
you can enrich it with additional information like project milestones, presentation dates and similar
events.
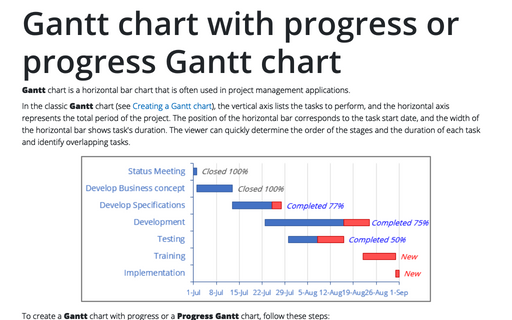
Gantt chart with progress or progress Gantt chart
Gantt chart is a horizontal bar chart that is often used in project management applications.


