Chart in Excel 2010
Using shortcut keys to create a chart
Excel propose easy and very fast way to create a chart by using shortcut keys.
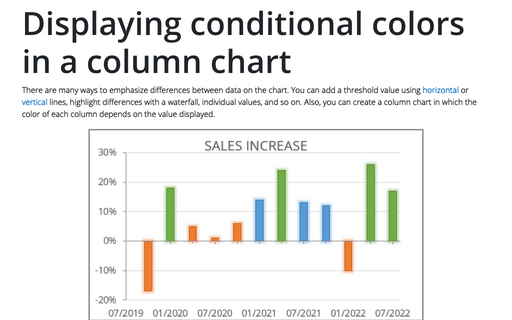
Displaying conditional colors in a column chart
To emphasize differences between data in the chart it will be interesting to create a column chart in which
the color of each column depends on the value displayed.
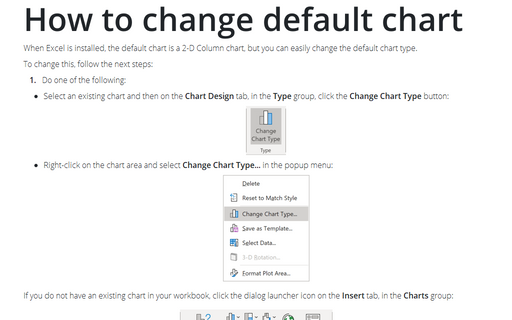
How to change default chart
When Excel is installed, the default chart is a 2-D Column chart but you can easily change the default chart
type.
Creating automatically extended plot ranges
If you often need to adjust your data ranges so that your charts plot an updated data range, you may be
interested in a trick that forces Excel to update the chart's data range whenever you add new data to your
worksheet.
A quick way to duplicate all of the custom chart formatting
Creation of a large number of visually consistent charts to represent different data is a time consuming and
error prone task, unless you know how to copy formatting between charts.
How to change the default colors that Excel uses for chart series
Every workbook uses a palette of 56 colors, but you can change palette for the current workbook or even
change the default colors for new workbooks.
How to create Master and Scrolled Detail charts
When you create a chart with a scroll bar, it will be useful create a chart with all data to see which data
fragment you see in the scrolling chart.
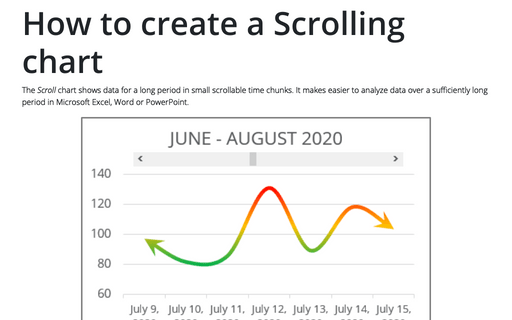
How to create a Scrolling chart
Sometimes you need to create a chart that shows a large data amount. Then it would be useful to insert a
scroll bar in your chart.
Bubble and Area chart
In this tip we will show how to different charts could be combined in the one chart. In example we will
combine a Bubble chart with an Area chart:
How to fix the chart data
You can unlink a chart from its data ranges and produce a static chart that remains unaffected by later
changes in the data.


