Excel 2003
Creating Your Own Menu
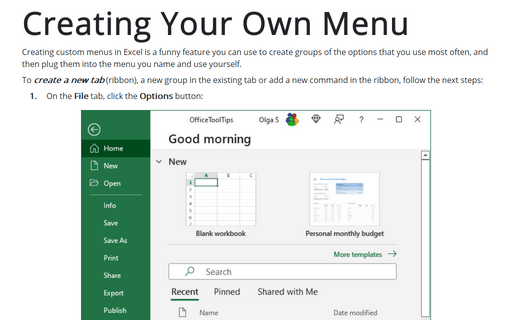
Creating custom menus in Excel is a fun feature you can use to create a list of the options you use most
often, and then plug them into a menu you name and use yourself.
Starting Excel without an Empty Workbook
If you prefer to avoid the empty workbook to be created when Excel starts up, you can do so by editing the
command line that is used to start Excel.
How to change the number of sheets for new workbooks
Excel automatically creates three worksheets in each new workbook, but you can force it to create as many
worksheets as you need.
Excel Formula auditing tools
If you would like to better understand how some of these complex array formulas work, consider using a handy
tool - Formula Evaluator:
Counting the number of unique values
You can easily count the number of unique values of the range using a simple formula.
Unique items in the list
In order to get unique items in a range you can use the Advanced Filter to extract the unique values
from a column of data and paste them to a new location.
Creating a glossy thermometer chart
Thermometer chart is nice indicator of the process with well-defined measure, e.g. task status. How to
create simple thermometer chart, see
Creating a simple thermometer chart.
This tip will teach you how make it more appealing for your audience.
Creating a Candlestick Stock chart with volume
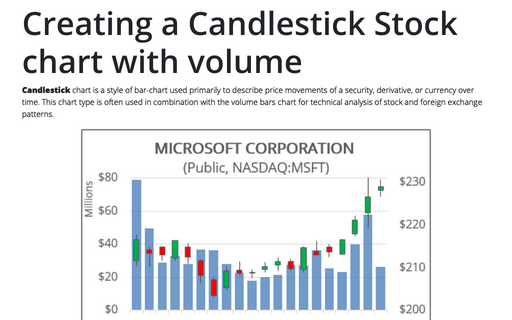
Candlestick chart is a style of bar-chart used primarily to describe price movements of a security,
derivative, or currency over time. This chart type is often used in combination with the volume bars chart
for technical analysis of stock and foreign exchange patterns.
How to create Waterfall chart
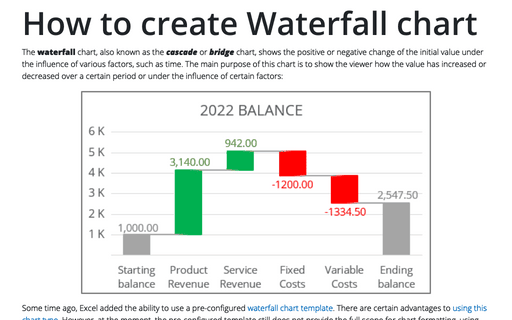
The waterfall chart is normally used for understanding how an initial value is affected by a series of
intermediate positive or negative values. Usually the initial and the final values are represented by whole
columns, while the intermediate values are denoted by floating columns.
How to hide points on the chart axis
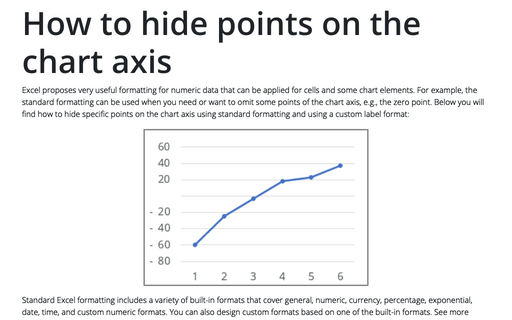
Sometimes you need to omit some points of the chart axis, e.g., the zero point. This tip will show you how
to hide certain points on the chart axis using custom label format.


