How to create a timeline in PowerPoint
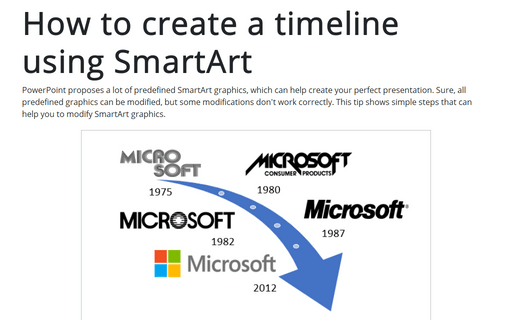
This tip shows simple steps for creating a simple and informative timeline using Microsoft logo design changes (see https://en.wikipedia.org/wiki/Microsoft#Logo).

You can use a similar predefined SmartArt graphic (see how to create a timeline using SmartArt):

To create a timeline chart like this one, do the following:
1. On the Insert tab, in the Illustrations group, select Shapes:

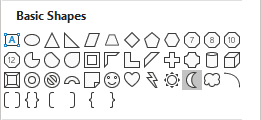
2. In the Shapes list, in the Basic Shapes group, choose the Moon shape:
3. Rotate the added shape: to do that, select the shape and do one of the following:

- Using the rotation handle at the top of the selecting border:

- On the Shape Format tab, in the Arrange group, select some
commands in the Rotate dropdown list:

4. Add the rectangle shape (from the same Rectangle group) and position it to hide the half of the moon shape:

5. Subtract the rectangle shape from the moon shape (see how to combine shapes to create a custom shape):

6. Add the arrow shape or the triangle shape to create an arrow:

7. Select both shapes and union them. Also, you can add new small round shapes to show the different distances between milestones in your timeline:

Note: Before adding milestone labels, group all objects for the arrow (when you will add pictures for milestones, you may need to change the arrow by stretching a bit or just moving).
8. For each milestone, do the following:
8.1. Add a shape from Callouts (on the Insert tab, in the Illustrations group, click the Shapes dropdown list):

In this example, it has been used Callout: Line with No Border:

8.2. Right-click on the shape and choose Format Shape... in the popup menu:
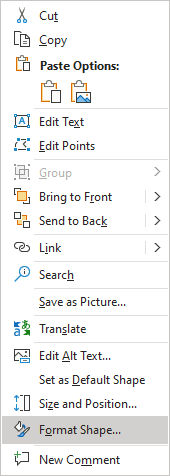
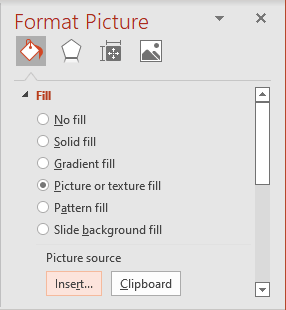
8.3. On the Format Shape pane, on the Shape Options tab, in the Fill & Line group, in the Fill section, select the Picture or texture fill checkbox and then click Insert... button:
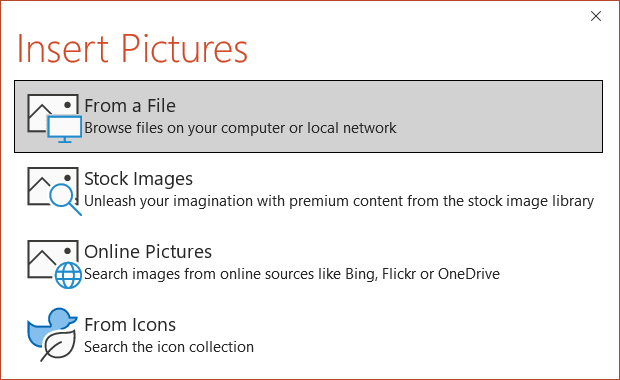
8.4. In the Insert Pictures dialog box, choose the picture location, select the picture file, and then click Open or Insert:
8.5. Position the shape and line of the shape:

8.6. Add the text box with the year and position it to the appropriate milestone:

9. Add any other adjustments to your slide.
See also this tip in French: Comment créer une ligne du temps dans PowerPoint.
