How to create dependent on a volume chart title

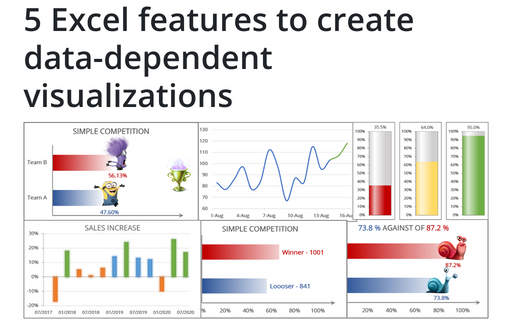
In the first example, in the title of the chart you will see the results of every team that will be changed by results:

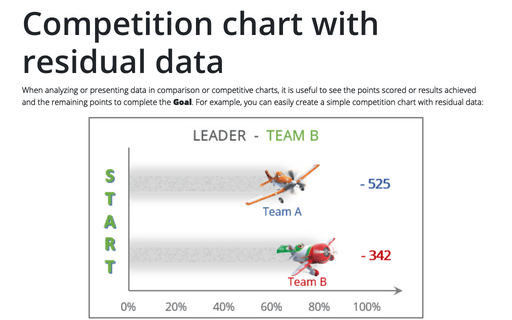
In the second example, in the title of the chart you will see the leader of the competition:

To create the chart with title like this one, do the following:
1. Create a chart (for example see Creating a simple competition chart).
2. In any cell, create the data that you want to see on the title of your chart. For these examples:


3. Add title in you chart and select it:
4. Click on the Formula bar, enter the symbol = and choose the cell with data for the title:

Make any other adjustments to get the look you desire, see also Creating a chart with dynamic labels.
See also this tip in French: Comment créer un titre de graphique dépendant de la valeur d'une cellule.


