Excel 2013
Protect Excel spreadsheet options
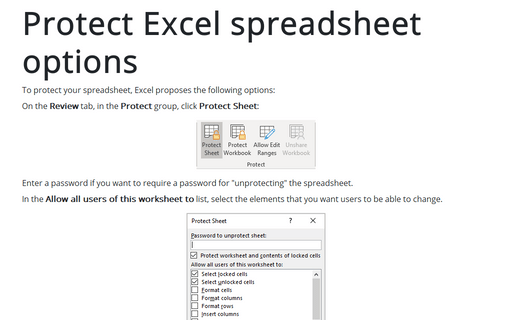
To protect your spreadsheet, Excel proposes the following options:
How to manage Add-ins
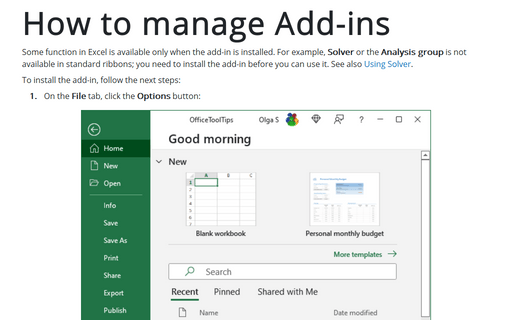
Some function in Excel is available only when the add-in is installed. For example, Solver or the
Analysis group is not available in standard ribbons, you need to install the add-in before you can
use it. See also Using Solver.
How to count cells by criteria
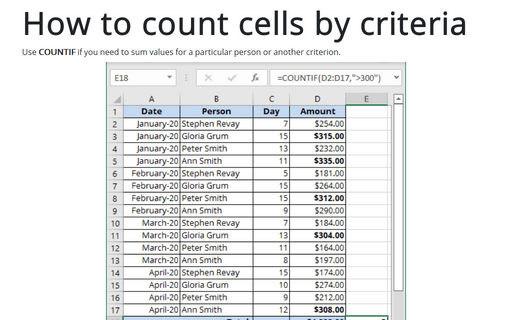
Use COUNTIF if you need to sum values for a particular person or other criterion.
How to sum cells by criteria
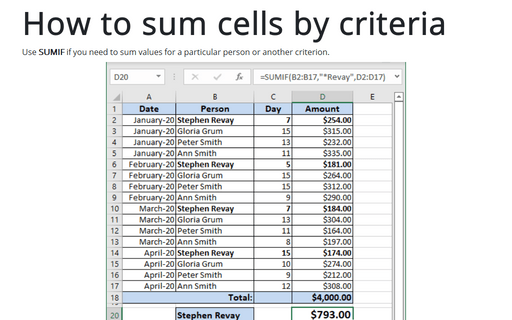
Use SUMIF if you need to sum values for a particular person or other criterion.
Simple combination chart
Sometimes you want to show a single chart that consists of series that use different chart types.
Creating a chart with critical zones
Periodical processes like volume of support service calls often have critical zones that indicate a serious
problem that need to be investigated and mitigated. This tips shows how to reveal and emphasis those
critical zones for analysis.
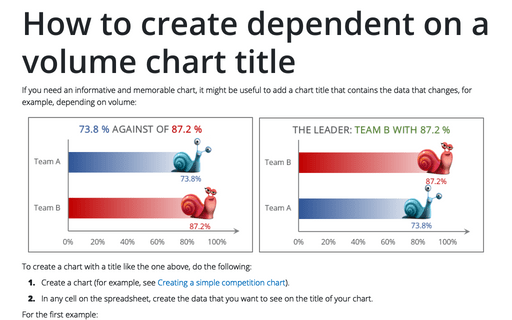
How to create dependent on a volume chart title
For some presentations will be interesting to add title that contains changeable data, for example,
dependent on volume.
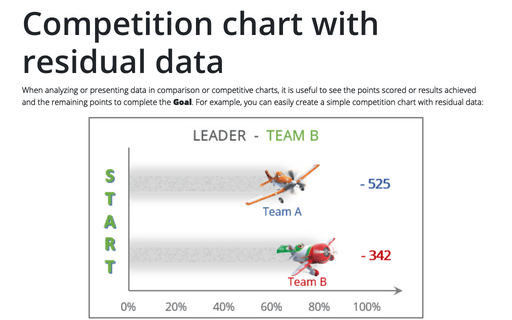
Competition chart with residual data
For some presentation of the competition will be more informative to see points that missed to achieve the
Goal. This tip is about how to create simple competition chart with residual data.
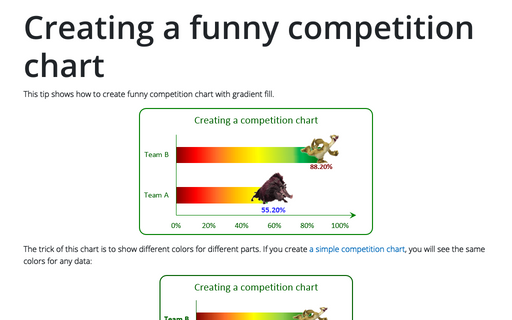
Creating a funny competition chart
This tip shows how to create funny competition chart with gradient fill.
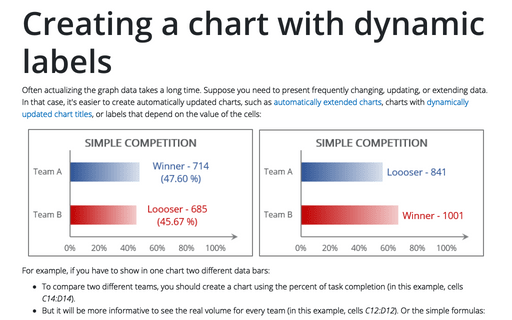
Creating a chart with dynamic labels
This tip shows how to create dynamically updated chart labels that depend on value or other cells.
